Our simulator allows you to simulate 100 future scenarios of your portfolios, estimate the expected risk, return and correlations, helping you to improve the diversification of your portfolios. The simulator projects the historical returns in future and is completely model-free (in particular, we don't make an unrealistic assumption of Normally-distributed returns). Though the past doesn't capture all possible future scenarios, it provides a good idea of possible outcomes.
With our portfolio simulator you can easily create, modify and delete your portfolios and simulate their expected risks and returns. We take daily historical returns for the last 10 years and project them for one year in future.
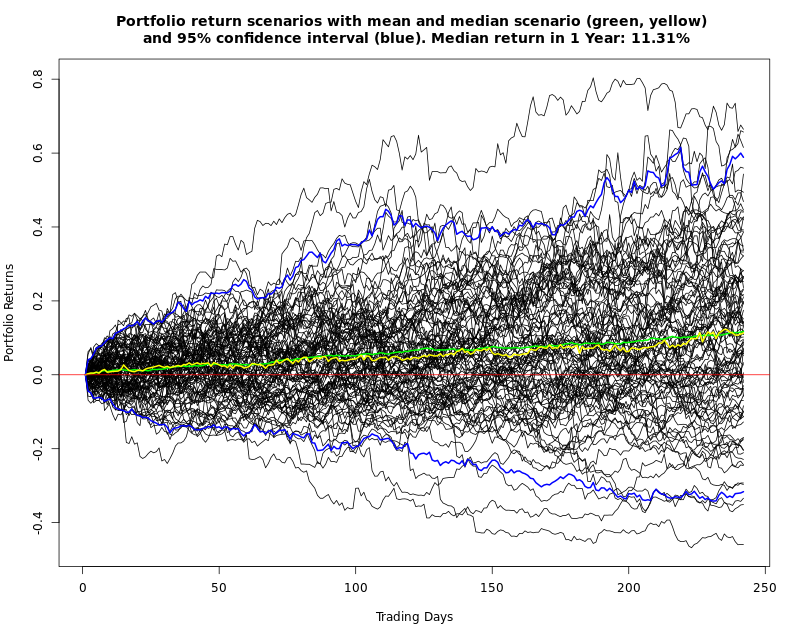 We calculate the mean and median returns. It is good if the mean and median lines lie closely to each other, since it means that your terminal return will most probably be close to the expected value.
However, sometimes it happens that the mean is (much) bigger than a median. In this case the mean (or expected) return is deceptive: most likely there are few extremely good scenarios, but their probability is low. Generally, the median is a better measure of central tendency than the mean value.
Blue lines are borders of the "typical" scenarios: 95% of scenarios are between the blue lines. In particular, it means that with the probability of 97.5% the return of your portfolio will not fall below the lower blue line.
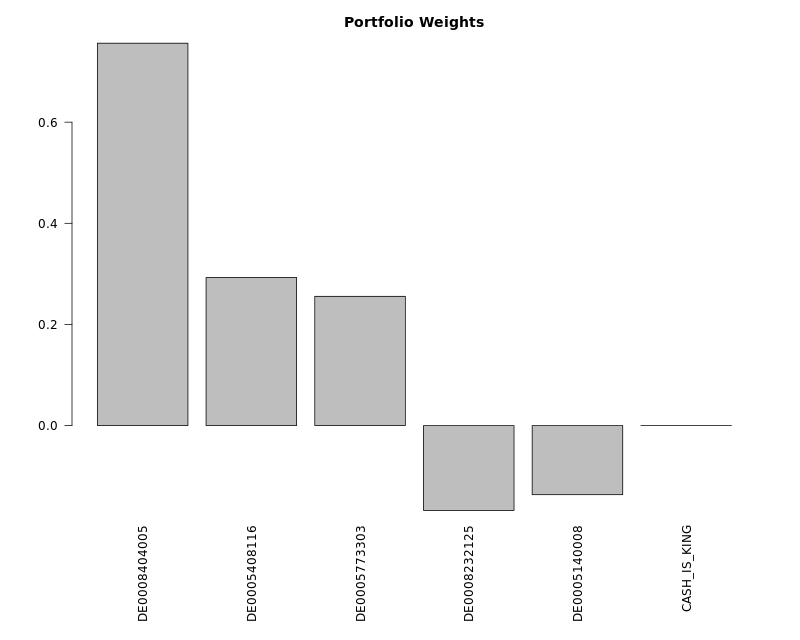
The next chart shows you the weights of your portfolio. Note that the negative weights (short-selling) are allowed. Especially for CFD traders it is not uncommon to sell short.
Further we cluster the historical daily portfolio returns in 3 groups: high, normal and low.
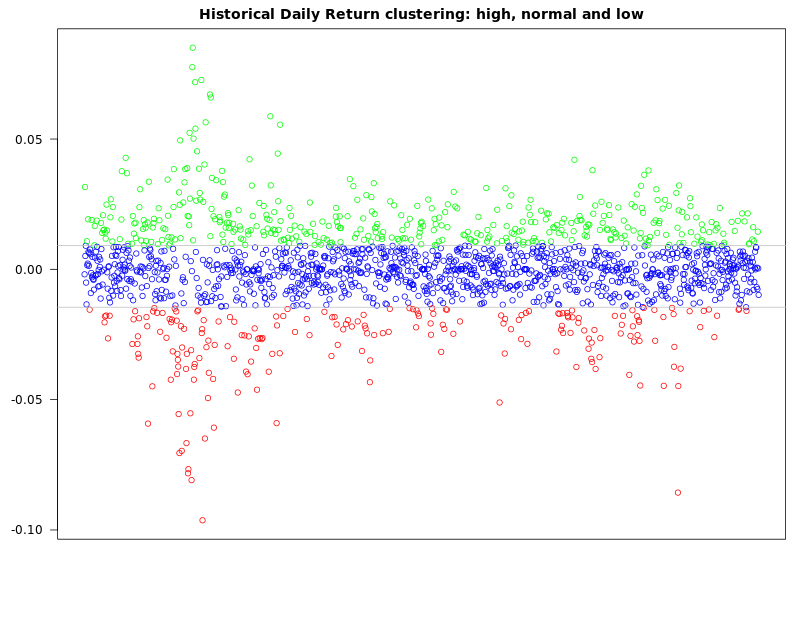 It gives you an idea of which (daily) portfolio volatility you can expect and is used to calculate the conditional correlations of the single components with the whole portfolio. This may help you to improve the portfolio diversification: look for stocks that have both low unconditional correlation (black dot) with portfolio and correlation, conditioned on low portfolio returns (red triangle).
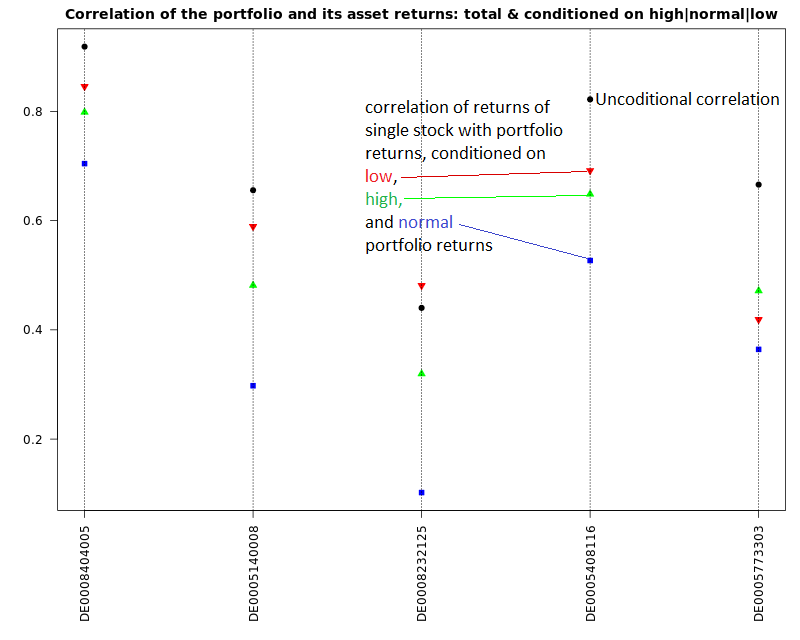 It usually makes sense to increase the weights of such stocks (unless they are already too high).
FinViz - an advanced stock screener (both for technical and fundamental traders)