Earlier we analyzed the performance of Einstein, a star trader on Wikifolio who has beaten (and continues to beat) the market. There is one more luminary on Wikifolio - and it is HBecker. Formally, Einstein is Number One in terms of absolute returns (by comparable historical drawdown). However, HBecker has even smoother equity curve and much better hit rate. If you still ask, who is better, the right answer is both are better! We summarize the trading history of HBecker and remind you that Wikifolio is an excellent place to learn from experienced traders but a bad place to invest your money unless you can deeply analyze the risks.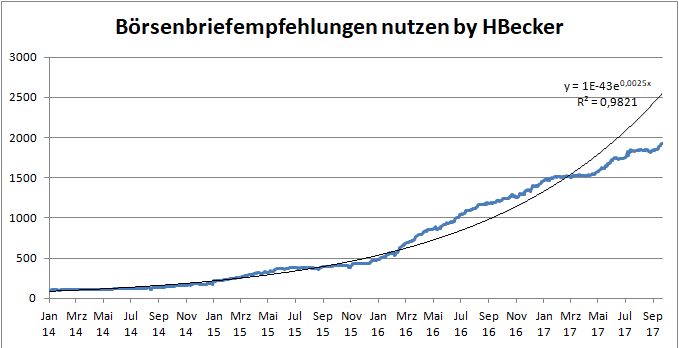
HBecker's wikifolio is called "Börsenbriefempfehlungen nutzen", which means "use recommendations from market newsletters". However, HBecker in no way blindly follows these recommendations :). Rather, he anticipates how a recommendation may influence the stock price or estimates which effect it has already taken (e.g. a breakthrough of a support or resistance level). HBecker also emphasizes that a good knowledge of companies fundamentals is essential. Like Einstein, he mostly trades with small caps, thus his strategy is unfortunately also non-scalable. Still for a retail trader there is more than enough liquidity.
We said that, formally, HBecker is the Number 2 since Einstein has even higher absolute return. However, many [risk-averse] investors would prefer HBecker on the risk-adjusted basis. HBecker's drawdown is smaller and his equity curve is smoother (note how close it is approximated by the exponential fit).
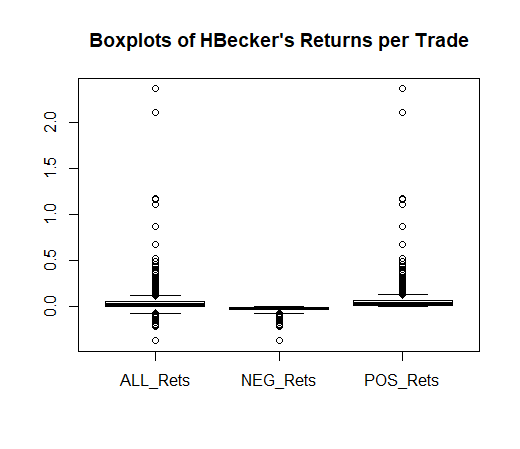
Further, his hit rate is extremely high: 978 / 1289 = 75.87% (for comparison: Einstein had "merely" 56.77%). Also the expected value of the positive returns is significantly higher than that of the negative returns.
| HBeckers trade statistics summary (on 23.09.2017) | |
| Number of SELL-trades | 1289 |
| ....with profit | 978 |
| ....with loss | 311 |
| expectation (stddev) of positive returns | 4.04% (13.78%) |
| expectation (stddev) of negative returns | -2.88% (4.04%) |
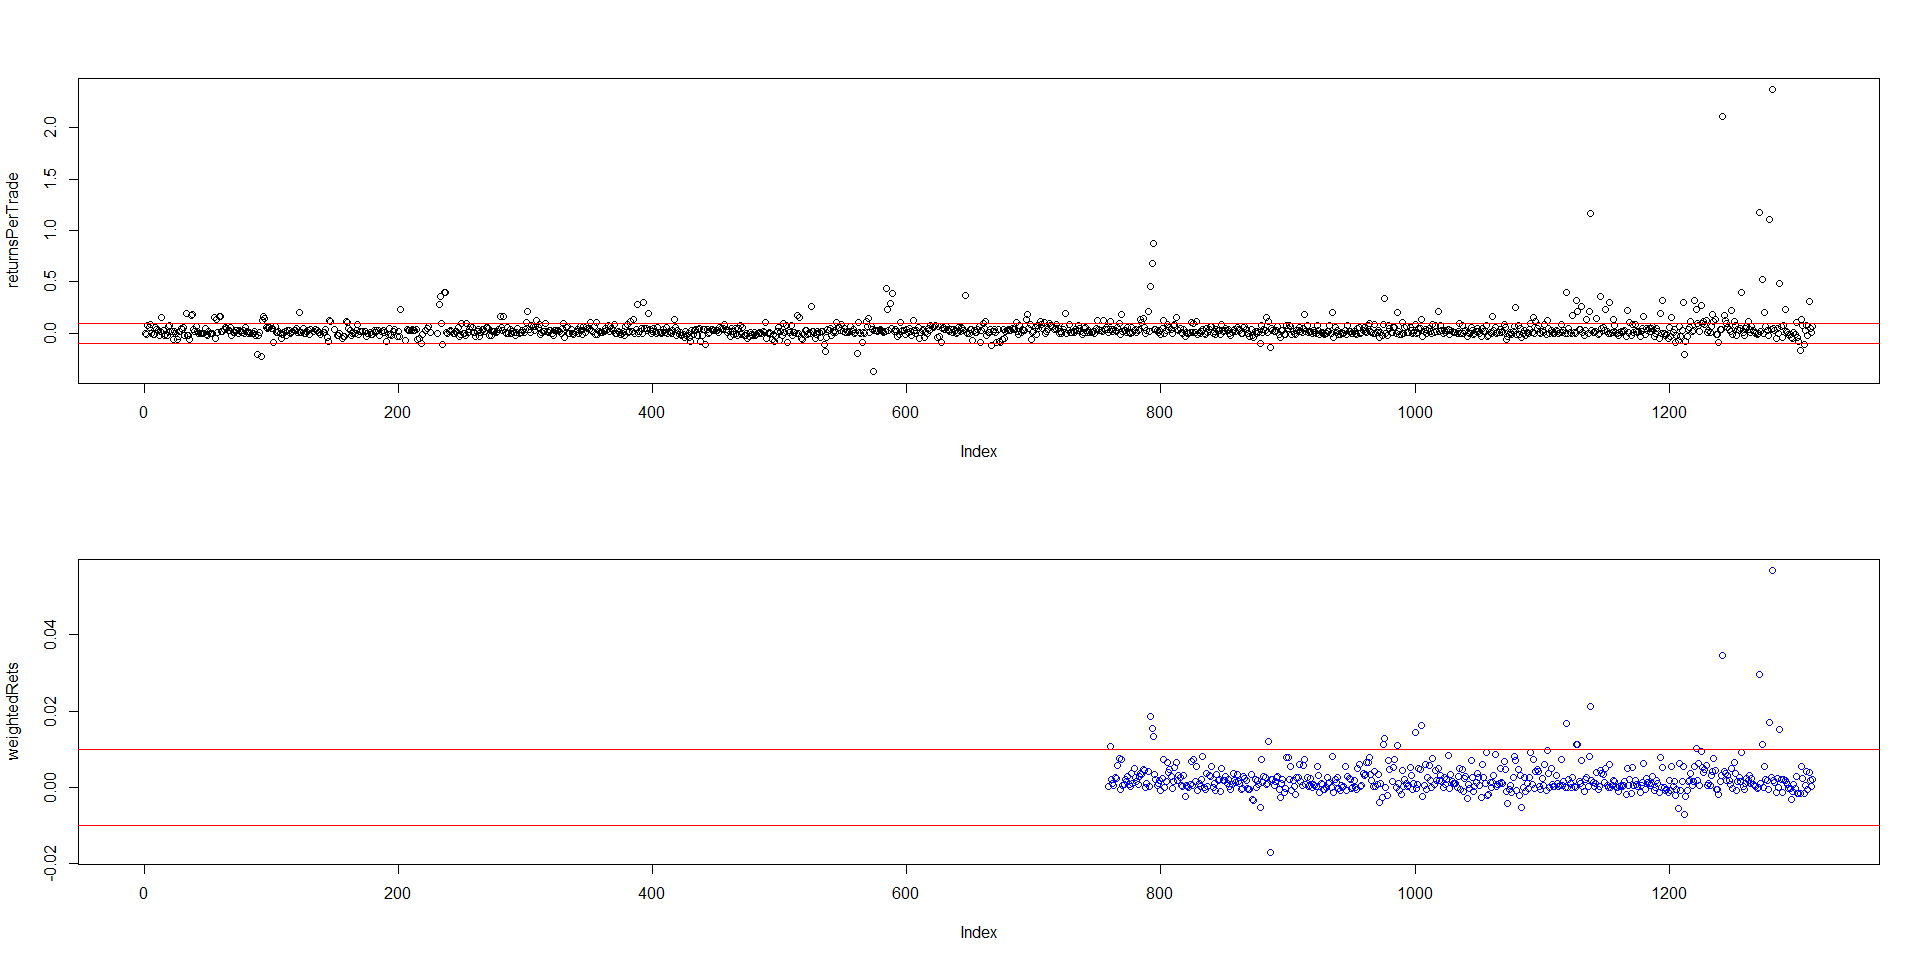
The returns (both per trade per se and weighted w.r.t. portfolio value) are also time homogeneous (unfortunately Wikifolio forgets some weights, so the second time series is shorter than the first).
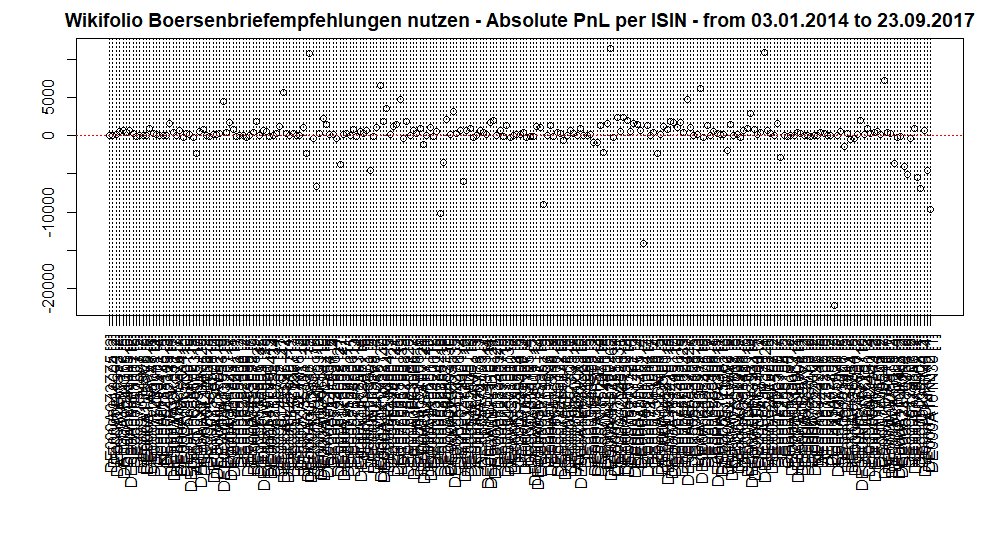
The contribution of the assets to HBecker's profit is more or less homogeneous as well: as you readily see (click on the image to download a scalable chart in .pdf) some stocks did better, some worse but (up to some outliers in both directions) all of them are comparable.
Finally, his sell2total ratio is about 0.5, which means that on average he commits one buy for each sell. This (together with his extremely high hit ratio) speaks for the fact, that he mostly trades the [almost] sure opportunities (and not the opportunities by which the odds are just slightly in his favor).
![]()
To sum up: HBecker is distinguished trader and yet another reason to keep the mouth shut for those, who affirm that nobody can beat the market! (Note that it is still correct that the absolute majority of both retail and institutional investors cannot beat the market).
FinViz - an advanced stock screener (both for technical and fundamental traders)