 QuantLib is a magnificent library for quantitative finance. But it is also like a gun, heavy enough to shoot your own foot. You might expect that QuantLibXL (a plug-in that provides a subset of QuantLib functionality in Excel) makes your life easier. Unfortunately, it hardly does, as we show in this case study. For an easy and straight way you should better have a look at Deriscope.
Previously we have explained how to build QuantLibXL from sources in Visual Studio 2017. Now let us consider a very common case study: fitting a yield curve, which may also be interesting for retail investors (who e.g. use a discounted cashflow model to evaluate stock fair values). If the zero yields are already quoted on the market, one can use the function qlInterpolatedYieldCurve pretty straightforwardly. For instance, ECB provides such this information. However, the "serious guys" are used to fit the yield curve directly from bond prices. Common approaches to do it are described in my QuantLib Notes and I don't want to repeat myself here. I just say that commonly they use the Nelson-Siegel-Svensson model in Europe and cubic splines in USA and Japan. Nelson-Siegel-Svensson is, so far, unavailable in QuantLibXL (but is readily available in Deriscope). Cubic Splines (and other interpolations methods) are available in qlPiecewiseYieldCurve function. One can also interpolate Discount-, Zero- or Forward-Rates thus - even though the European guys are missing NSS method- the function is pretty powerful. However, its usage may be a hell job, as we now demonstrate.
For our toy example (3 German government bonds) let us get data from Deutsche Finanzagentur (German Finance Agency).
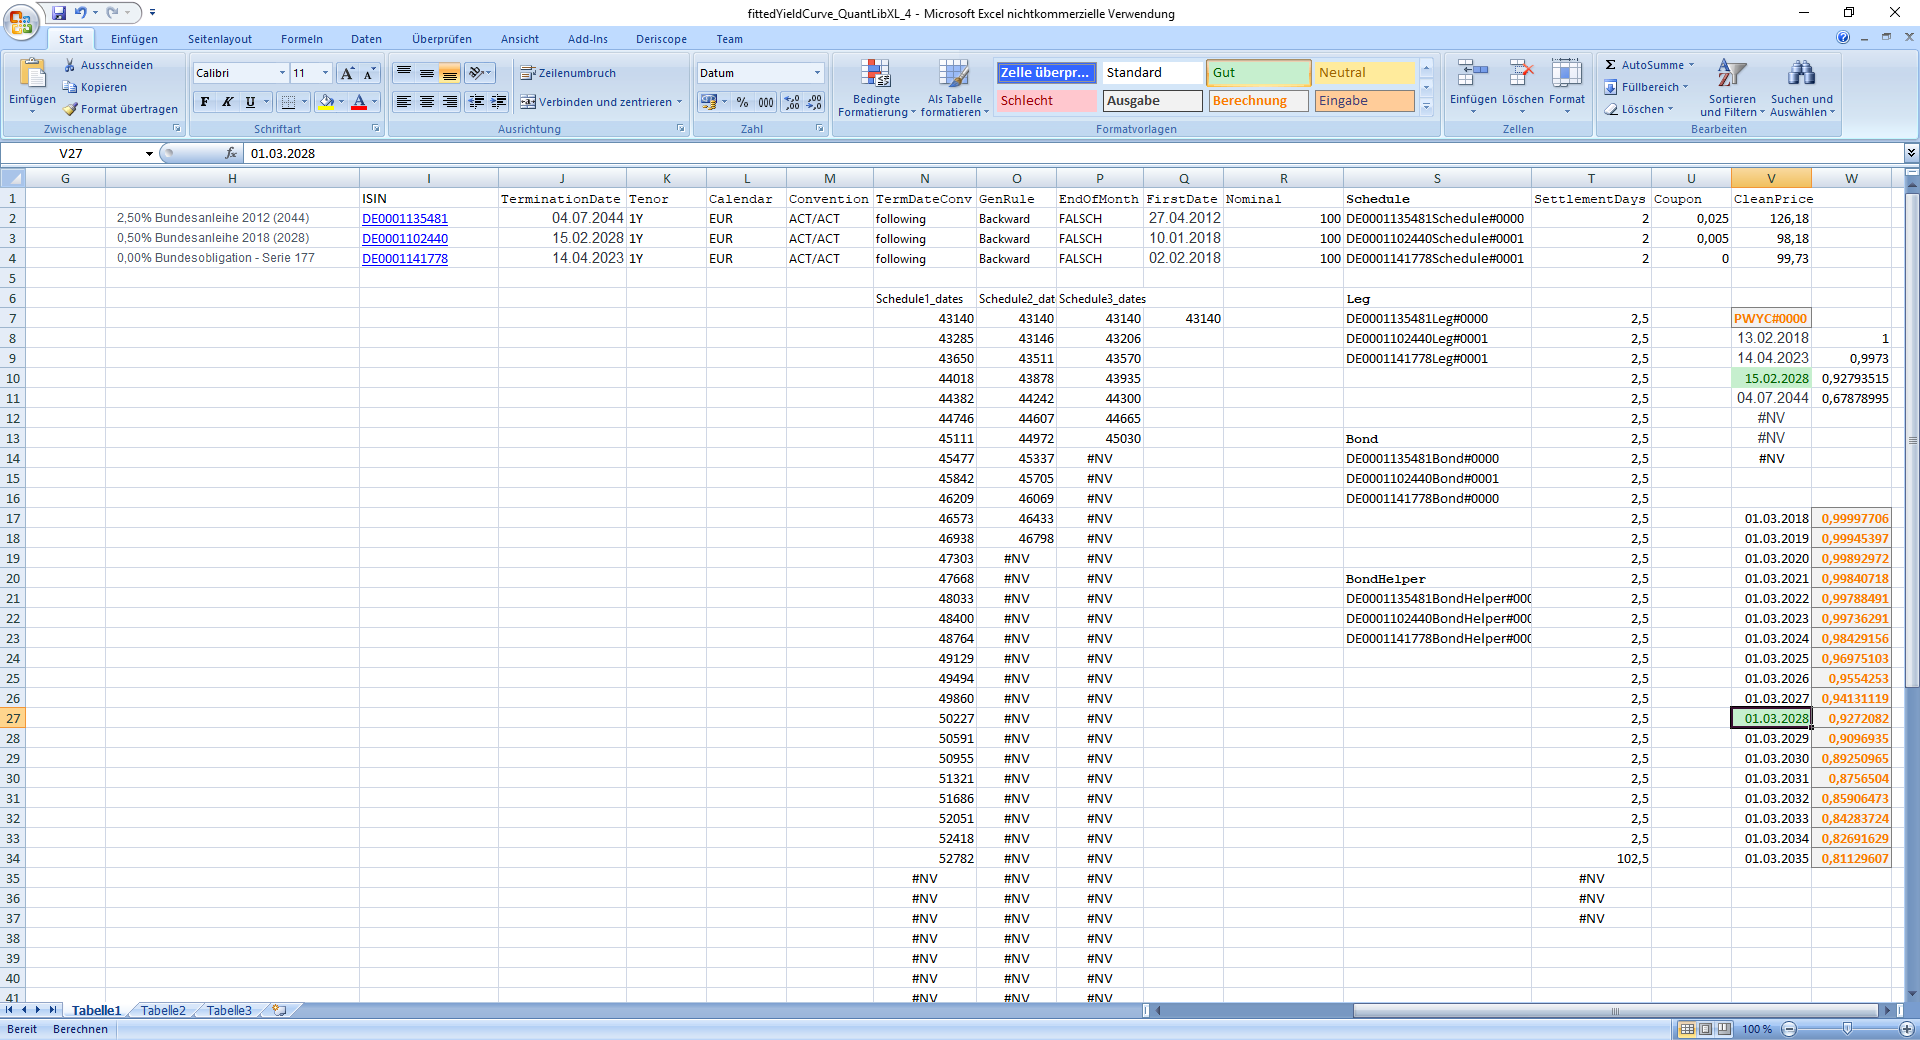
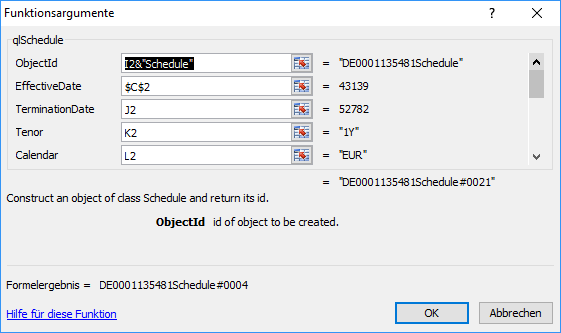
First of all we need to create schedules (of payments) for our bonds, which is relatively easy: =qlSchedule(I2&"Schedule";$C$2;J2;K2;L2;N2;N2;O2;P2)
Then we need a leg, which assigns payments to the dates of the schedule. And here we have a challenge: normally, we want to generate a leg object in a single cell, otherwise our excel sheet will readily get confusing.
Well, there is a trick to use a complicated mixture of ohFilter and array formulas.
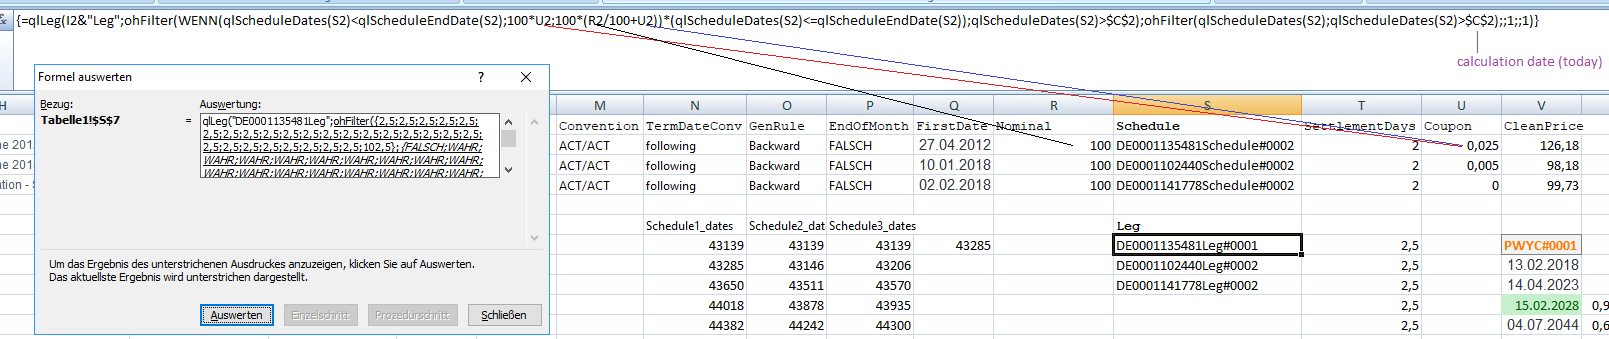 Essentially, it means the following:
1). At the first step we pay the coupon for all coupon dates WENN(qlScheduleDates(S2)<qlScheduleEndDate(S2);100*U2 and additionally redeem the face value on the last coupon date 100*(R2/100+U2)
2). Additionally, we need to filter out already paid coupons thus qlScheduleDates(S3)>$C$2 (where C2 is the calculation date).
If you make a mistake and put into your formula e.g. "$B$2" instead of "$C$2" (as I accidentally did at first), your Excel will crash. You may try it at your own risk: fittedYieldCurve_QuantLibXL_3
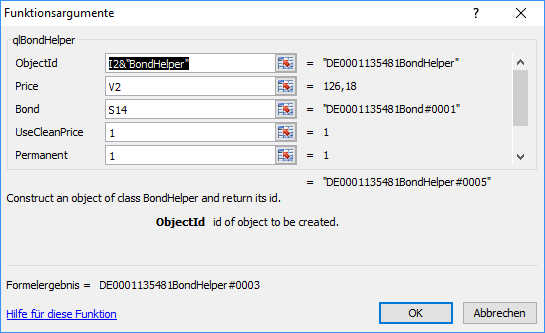
Then we create a bond from a Leg-object (some parameters engaged in creation of Schedule and Leg are redundantly used in bond definition) + specifying SettlementDays (a number of days the backoffice requires to to do their job). Further we create BondHelpers (bond objects, paired with their current market [clean] price).
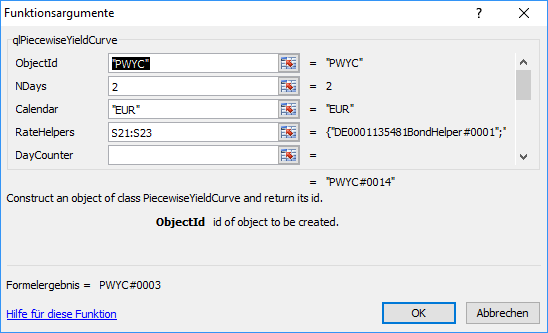
Having your BondHelpers your can specify the PiecewiseYieldCurve (it requires RateHelper as input parameters but BondHelper class is derived from RateHelper). Many parameters can be omitted (then the default value will be taken) but if you omit the Calendar, you will get an exception
Finally, you can specify the dates, to which you need the discount factors and get them from your PiecewiseYieldCurve Object
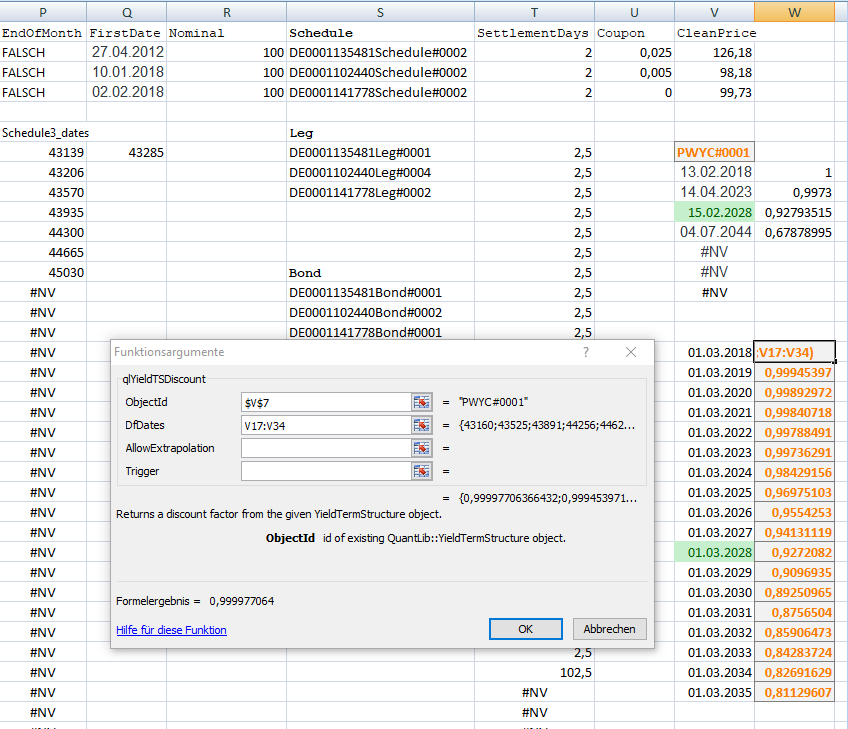
Here is the demo excel sheet: fittedYieldCurve_QuantLibXL_4.
Easy?! Intuitive?! I don't think so. If you want a direct way (not for all but for the most common use cases), then try the Deriscope. And if you are missing some features, do not hesitate to contact Ioannis.
But if you still want to stick to QuantLibXL, read further.
First of all, you need to be able to debug what you are doing in Excel. Otherwise it is really no-go: QuantLibXL is very poorly documented and reading its code is really cumbersome.
In order to enable the debugger you need to start Excel via Visual Studio, configuring your project settings as follows:
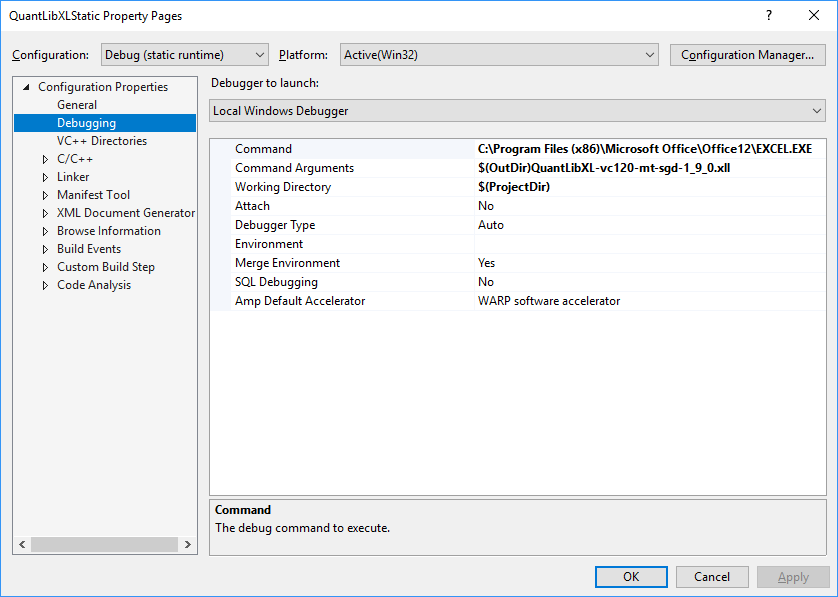
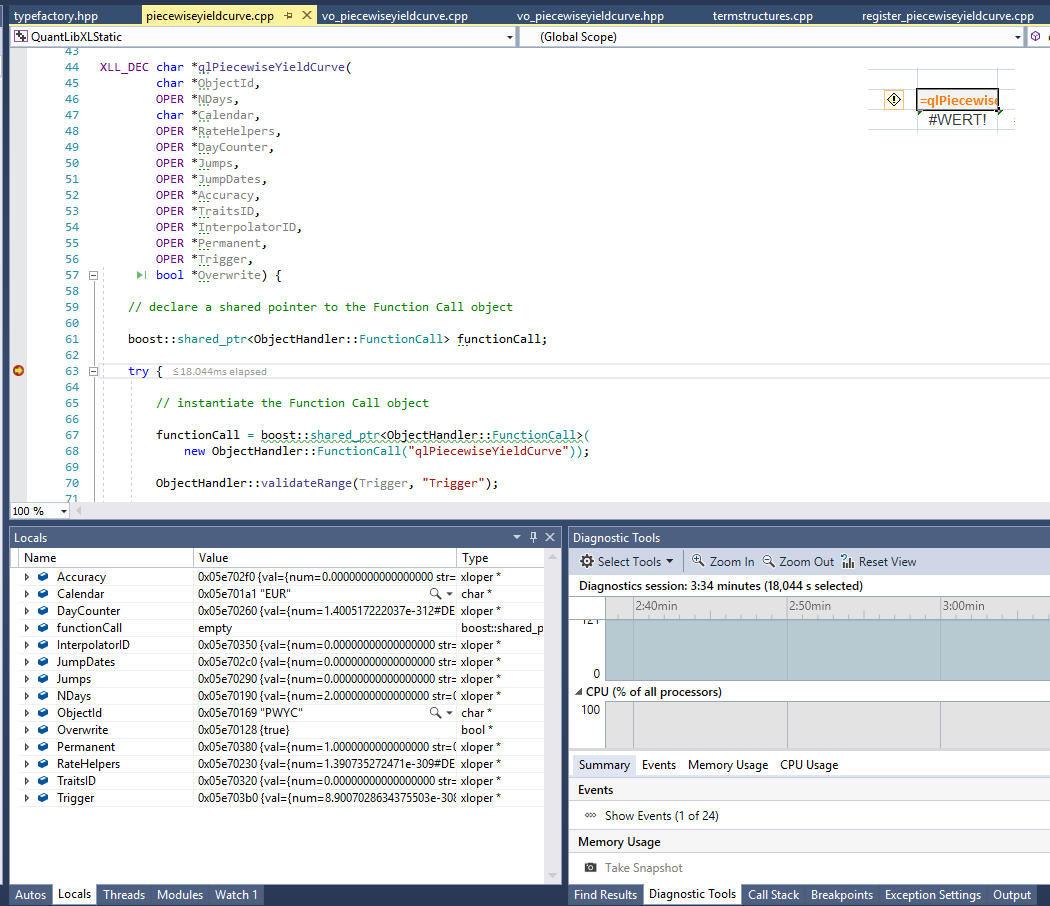
After pressing "Start" (F5) in Visual Studio you will get something like this
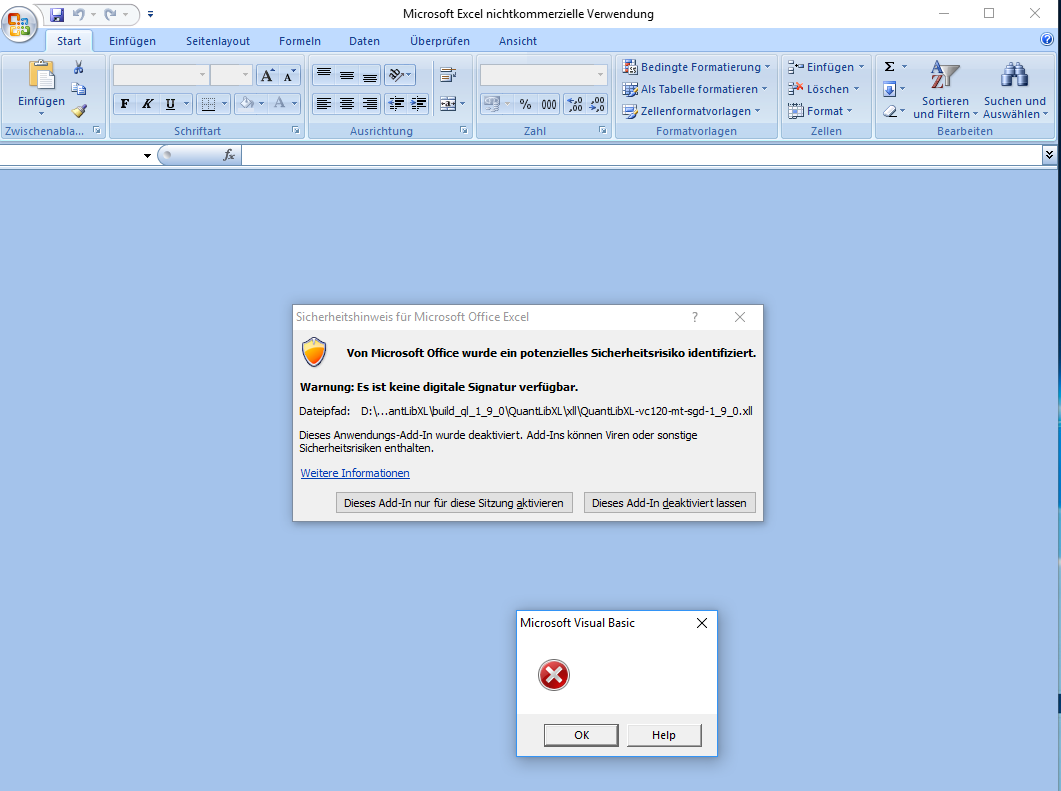
Then set the breakpoints in your C++ code and open your Excel workbook. The breakpoints will be heat each time the respective function is called.
Further you need to understand some key concepts of QuantLibXL:
1) Every non-trivial entity is saved as an object. In ObjectId you specify the name of the object and then can reference this object by its name.
2) Objects may be permanent or not (default is not). You read about object permanence (and triggers) here. As to triggers, they are, in a sense, the realization of Observer/Observable pattern, which I have briefly described in my QuantLib Notes. Setting triggers properly may be a fine art.
3) Unless you have counter-arguments, you should set "overwrite" parameter to TRUE, otherwise when you press F9 (recalucale workbook), you may encounter an error because the object with such name already exist.
And last but not least: Excel and QuantLibXL is for rapid prototyping, not for productive applications in day-to-day usage! Avoid the temptation to take over your Excel prototypes in production, you will regret it sooner or later! Especially if you introduce some additional dependencies (e.g. to a database) and cannot straightforwardly debug your application.
But what is an alternative,
If I need to have my solution fast?!
You may ask
Well, there is no silver bullet approach but if you want to develop your solution fast, QuantLib-Python may be a promising option. As I have already mentioned, I am, myself, not a Python programmer. But currently I feel the urge to learn it (thanks to numerous Deep Learning libraries and QuantLib-Python). The only aspect that worries me: at latest QuantLib User Meeting Luigi said, he is not going to migrate to Python 3. I hope he will change his mind because I am a big fan of static type specification (in case of big software projects).
FinViz - an advanced stock screener (both for technical and fundamental traders)