By current artificial intelligence, big data and robo-advisory hype many people believe that computers can do everything for you. I am pretty skeptical about it. Never denying (and actively engaging by myself) a computer-aided trading and investment I always claim "man and machine" rather than "man vs. machine". In this post I show you how to summarize and visualize the data from Alpha Vantage for 6356 American stocks.
To be true I, until recently, was primarily concentrated on the German stocks. It was not implausible since I live in Germany and by trading and investment decisions rely not only on numbers but also on a non-quantifiable information that I get by a "field work".
However, two things have revolutionized my attitude to American stocks: low fees for NYSE and NASDAQ by broker DeGiro and free data provider Alpha Vantage.
Although the stocks (at least in well-developed markets) share a lot of common features, there are also enough aspects in which the German and the American stocks differ. So my goal at the first step is to get a holistic view on American stock market.
Obviously, it makes little sense to get started with the daily or intraday data (although Alpha Vantage does provide them upto 1-min granularity). The best trade-off between the graspability and the granularity is to work on monthly basis. However, we are not going to request the OHLC monthly data directly, rather we will aggregate the daily adjusted data to the monthly or yearly data.
You get the data from AlphaVantage as follows (don't forget to put mapping.txt in D:/FIN_PORTAL/tmp/ before running this code :))
tickers = read.table(file="D:/FIN_PORTAL/tmp/mapping.txt")
pfad="D:/FIN_PORTAL/tmp/charts/"
N = dim(tickers)[1]
LST = list() #here we keep the OHLC data frames for future processing

library(alphavantager)
library(quantmod)

for(j in 1:N)
{
possibleError <- tryCatch({
    av_api_key("your_AlphaVantage_Key_here")
    smb = as.character((tickers$ticker)[j])
    nme = as.character((tickers$asset_name)[j])
    av=av_get(symbol = smb, av_fun = "TIME_SERIES_DAILY_ADJUSTED", outputsize = "full")
    dv = as.data.frame(av)
    LST[[j]] = dv

    yyy<-as.xts(dv[,2:7], as.POSIXct(dv$timestamp))
    zzz = as.xts(dv[,6:7], as.POSIXct(dv$timestamp))
    mmm = to.monthly(zzz)
    png(paste0(pfad, j,"_",smb, "__", nme,".png"), width=1920, height=1080)
    chartSeries(mmm, name=paste0(smb, " | ", nme), theme=chartTheme('white',up.col='blue',dn.col='red'))
    dev.off()
  }, error = function(er) {})
  if(inherits(possibleError, "error")) next
}
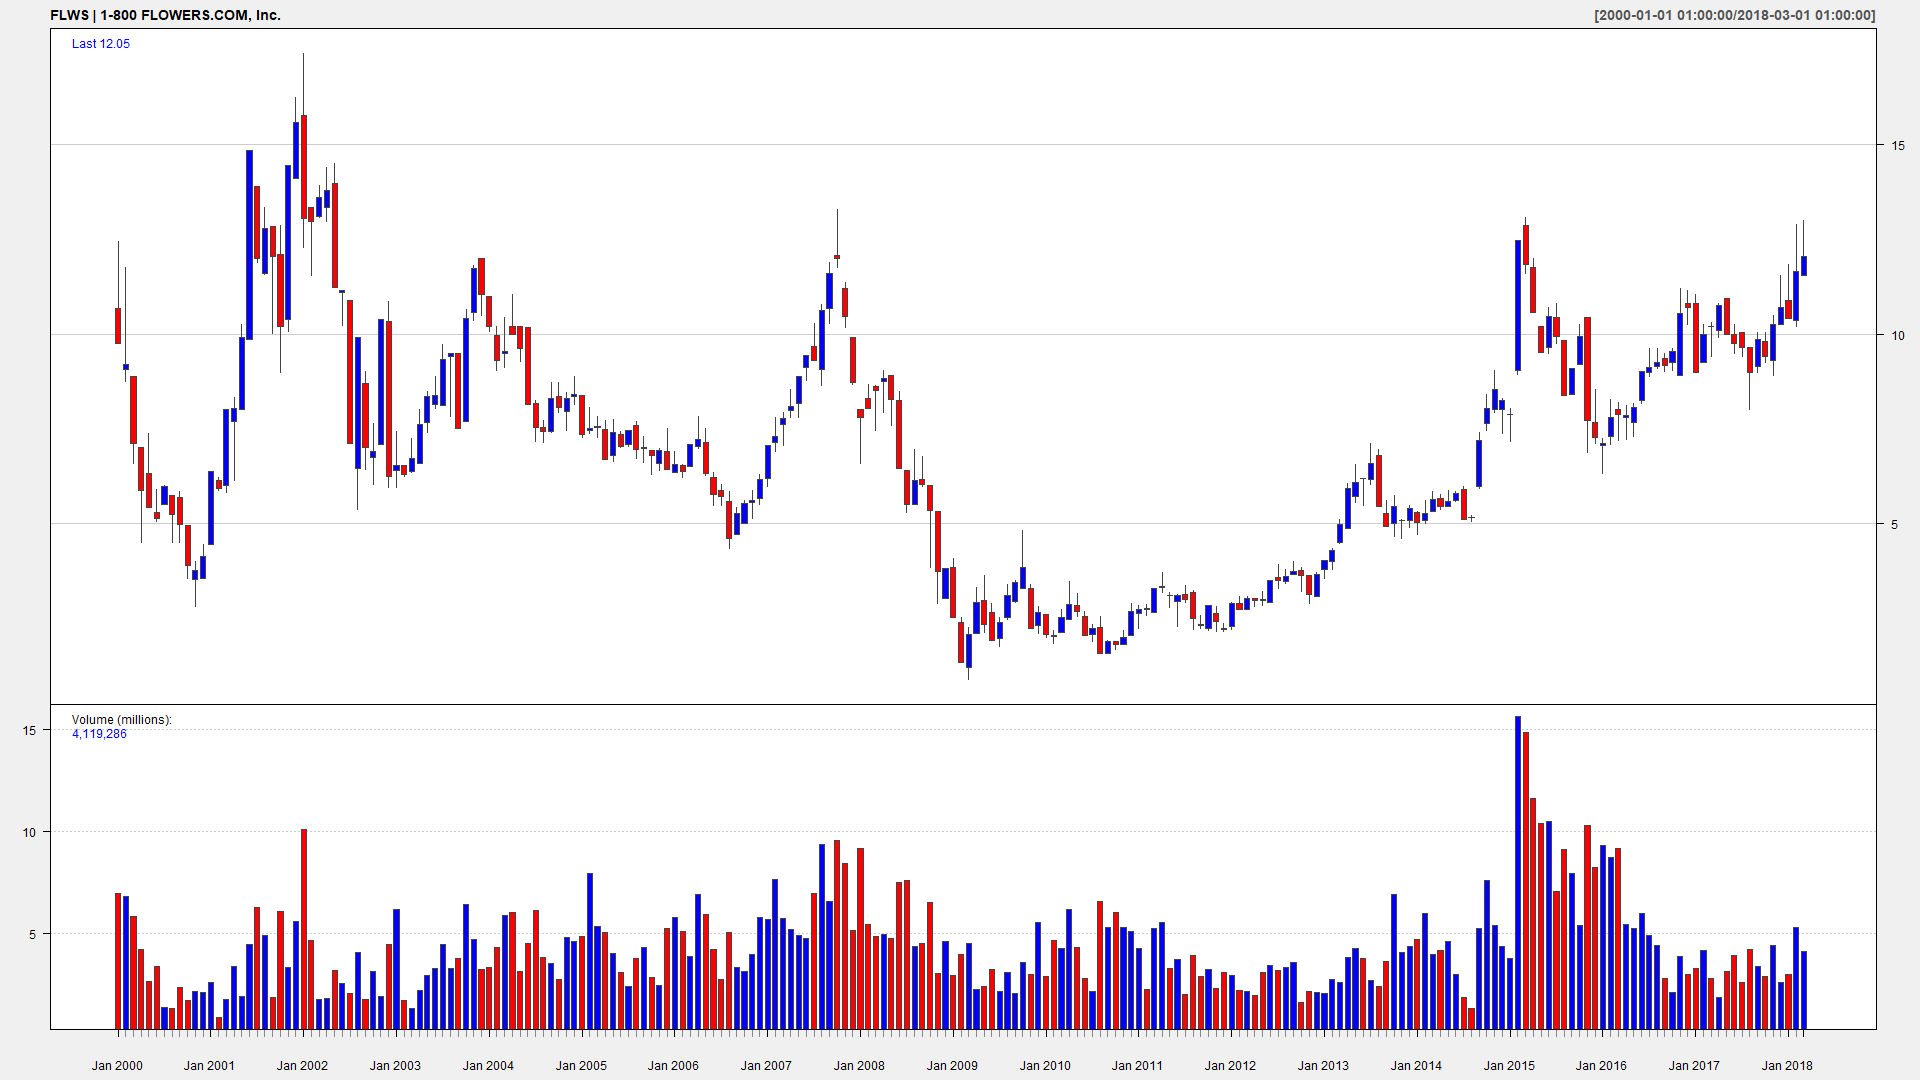
As a result you get a gallery of suchlike charts, which you can, if necessary, enrich with the indicators of technical analysis (check the documentation of quantmod). Note that we need tryCatch({...}) trick to intercept possible connection problems with AlphaVantage server, otherwise our R-Script may terminate abruptly. 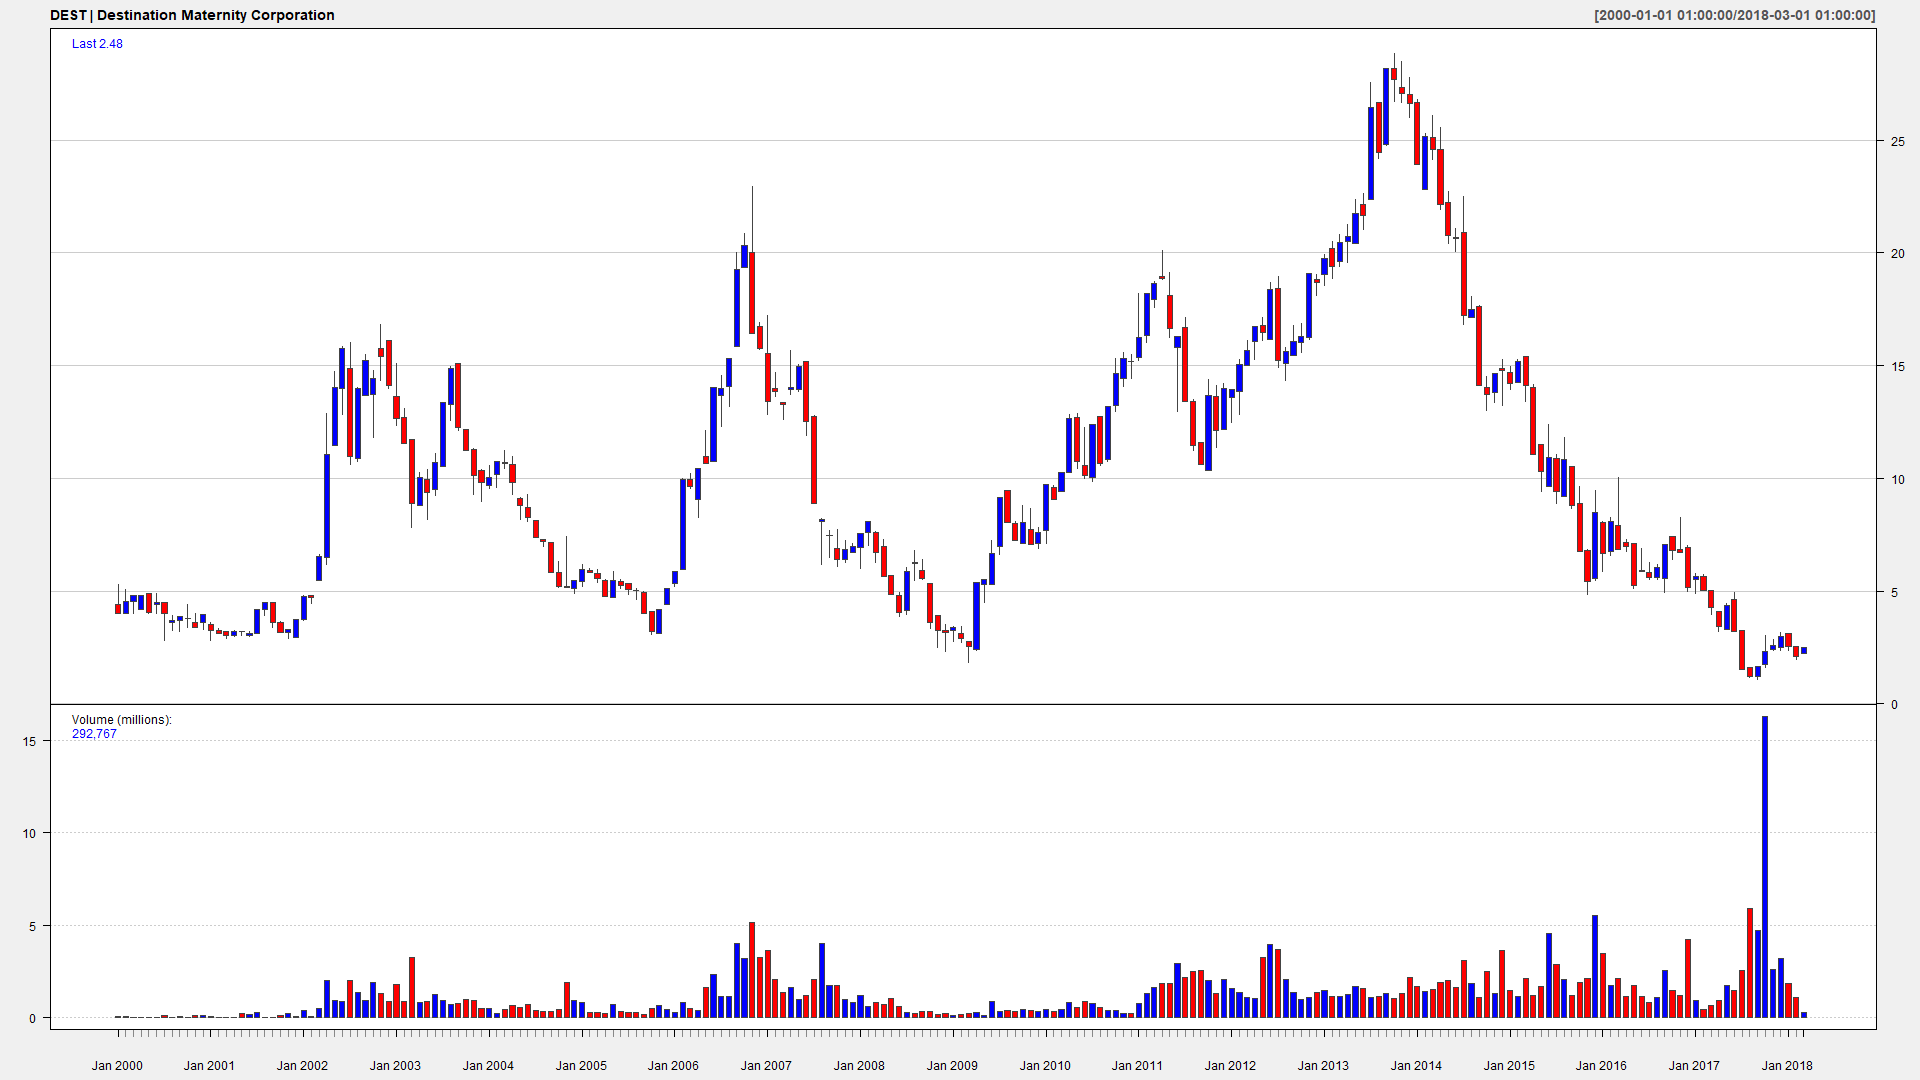
It took by me about 10 evenings to thoroughly reflect on this gallery and to train a (hopefully) deep neural network in my own brain.
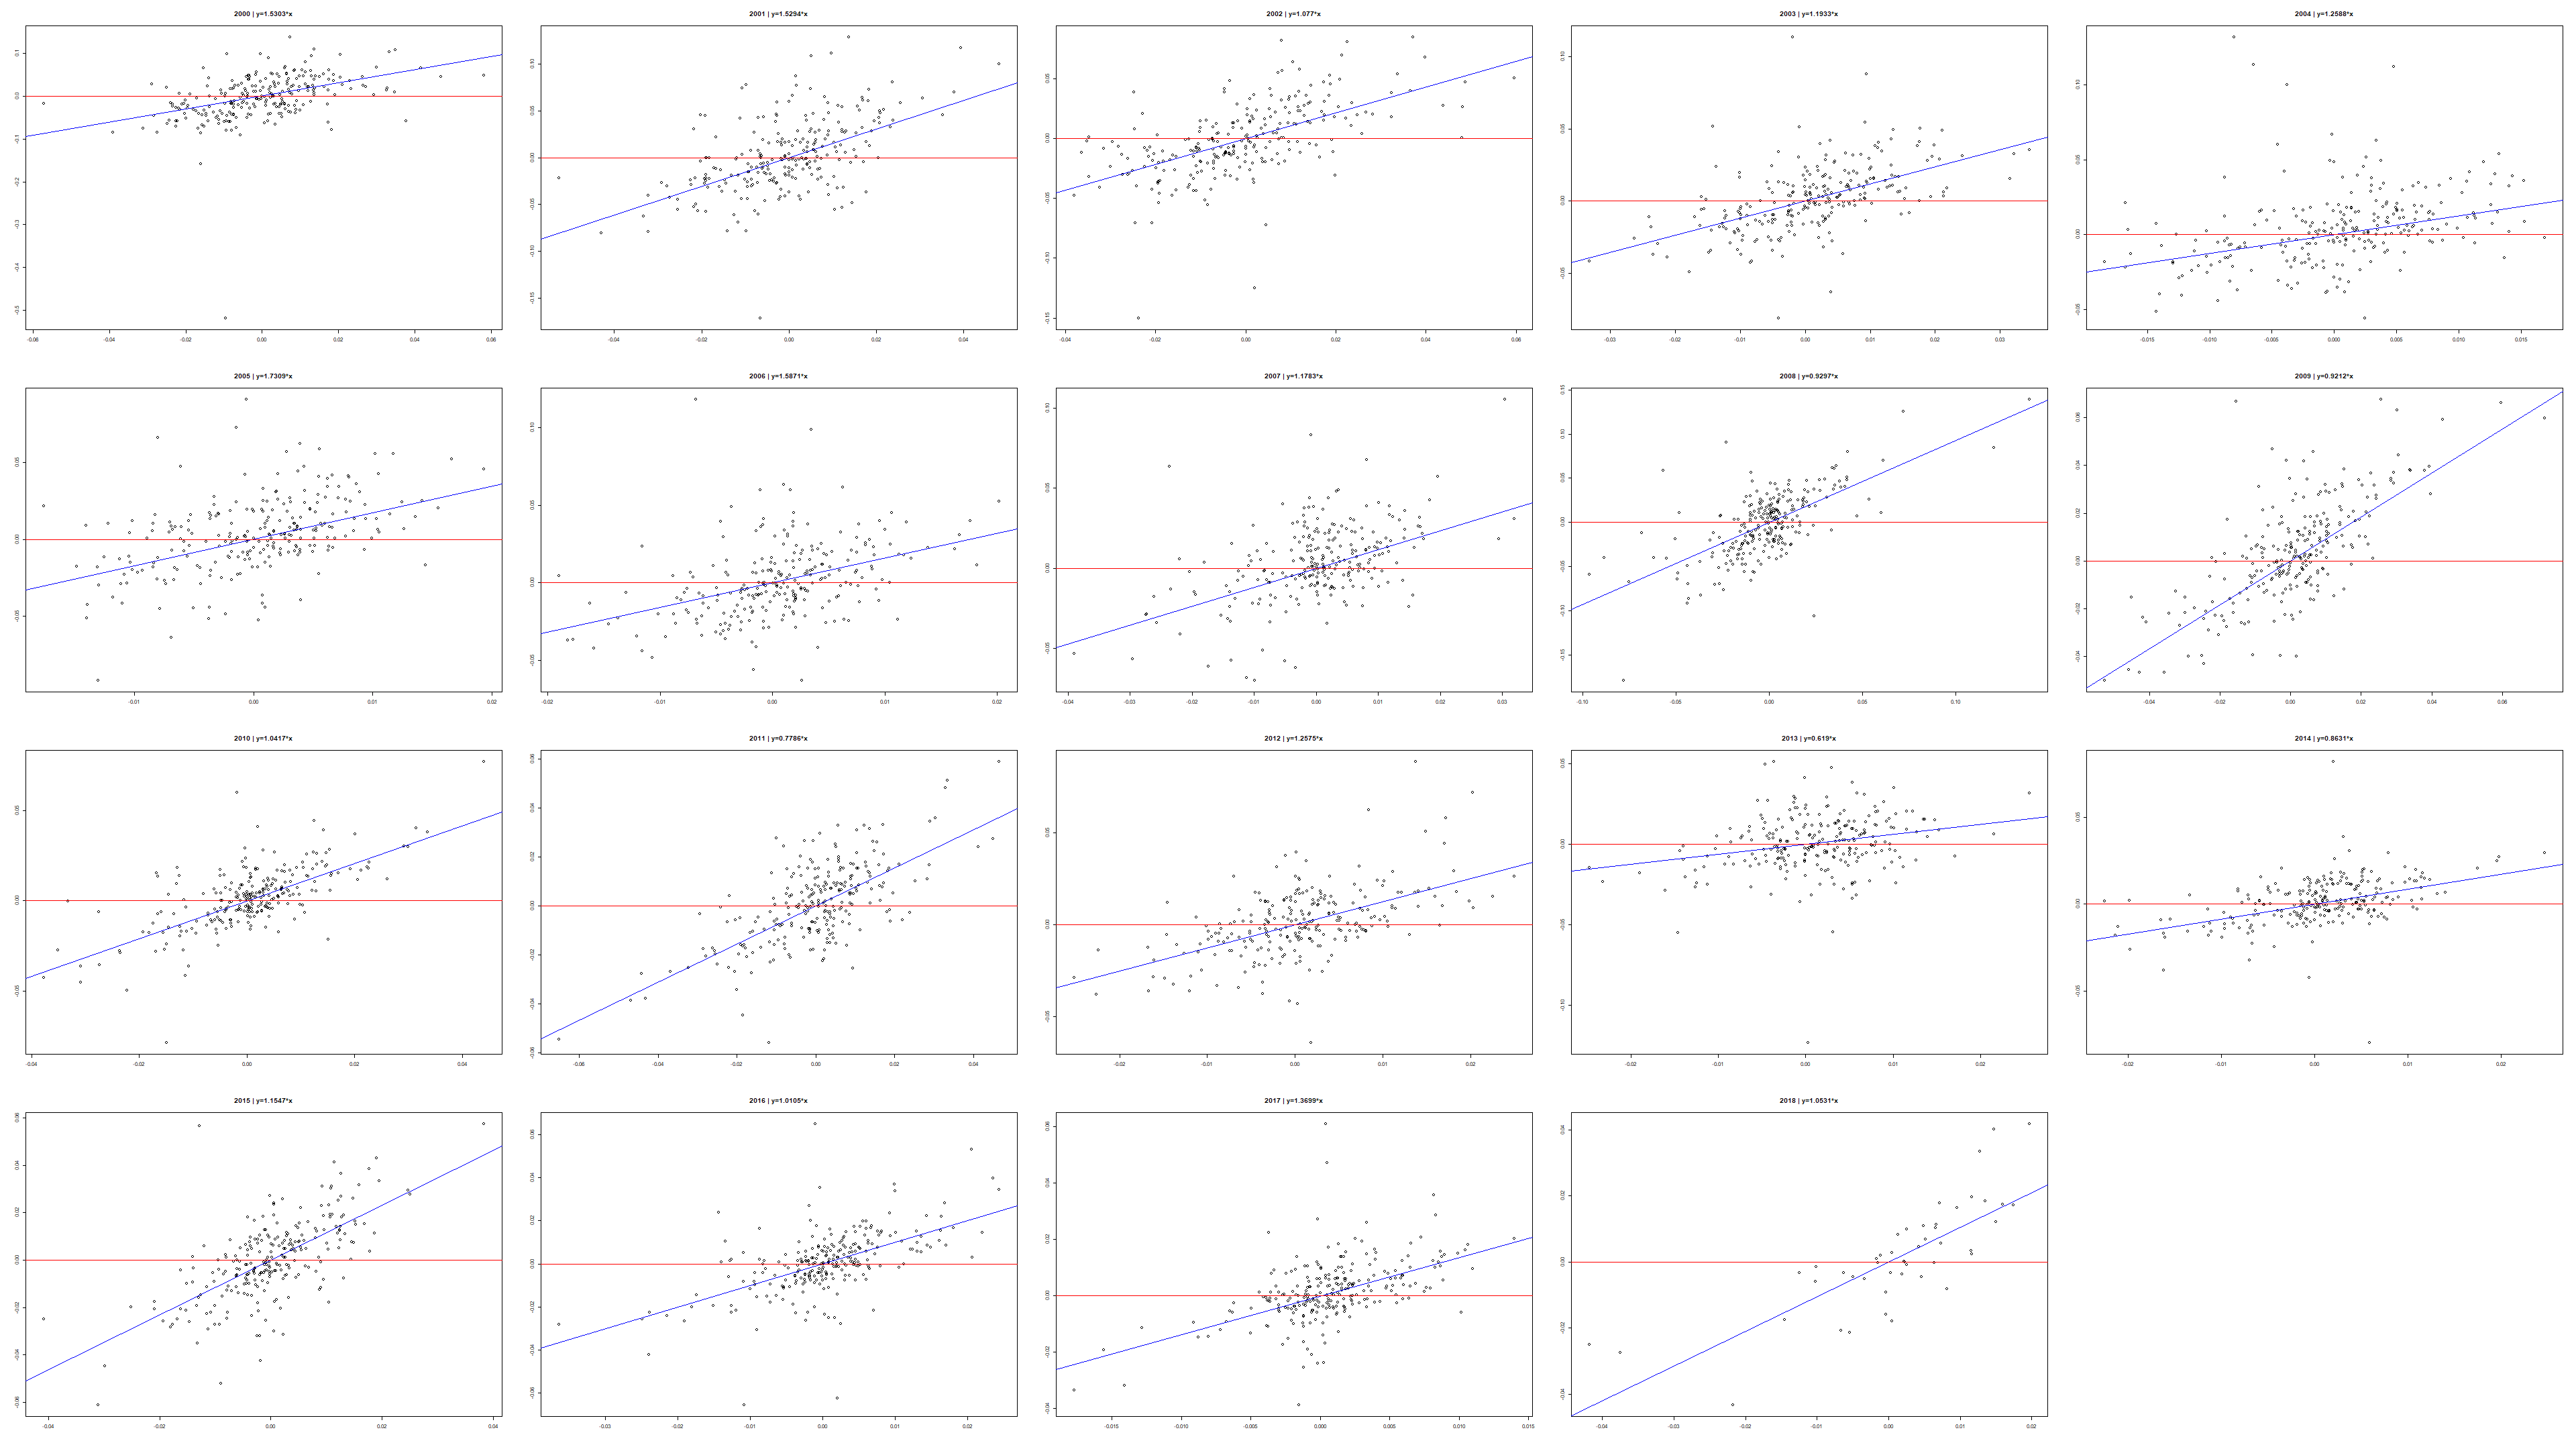
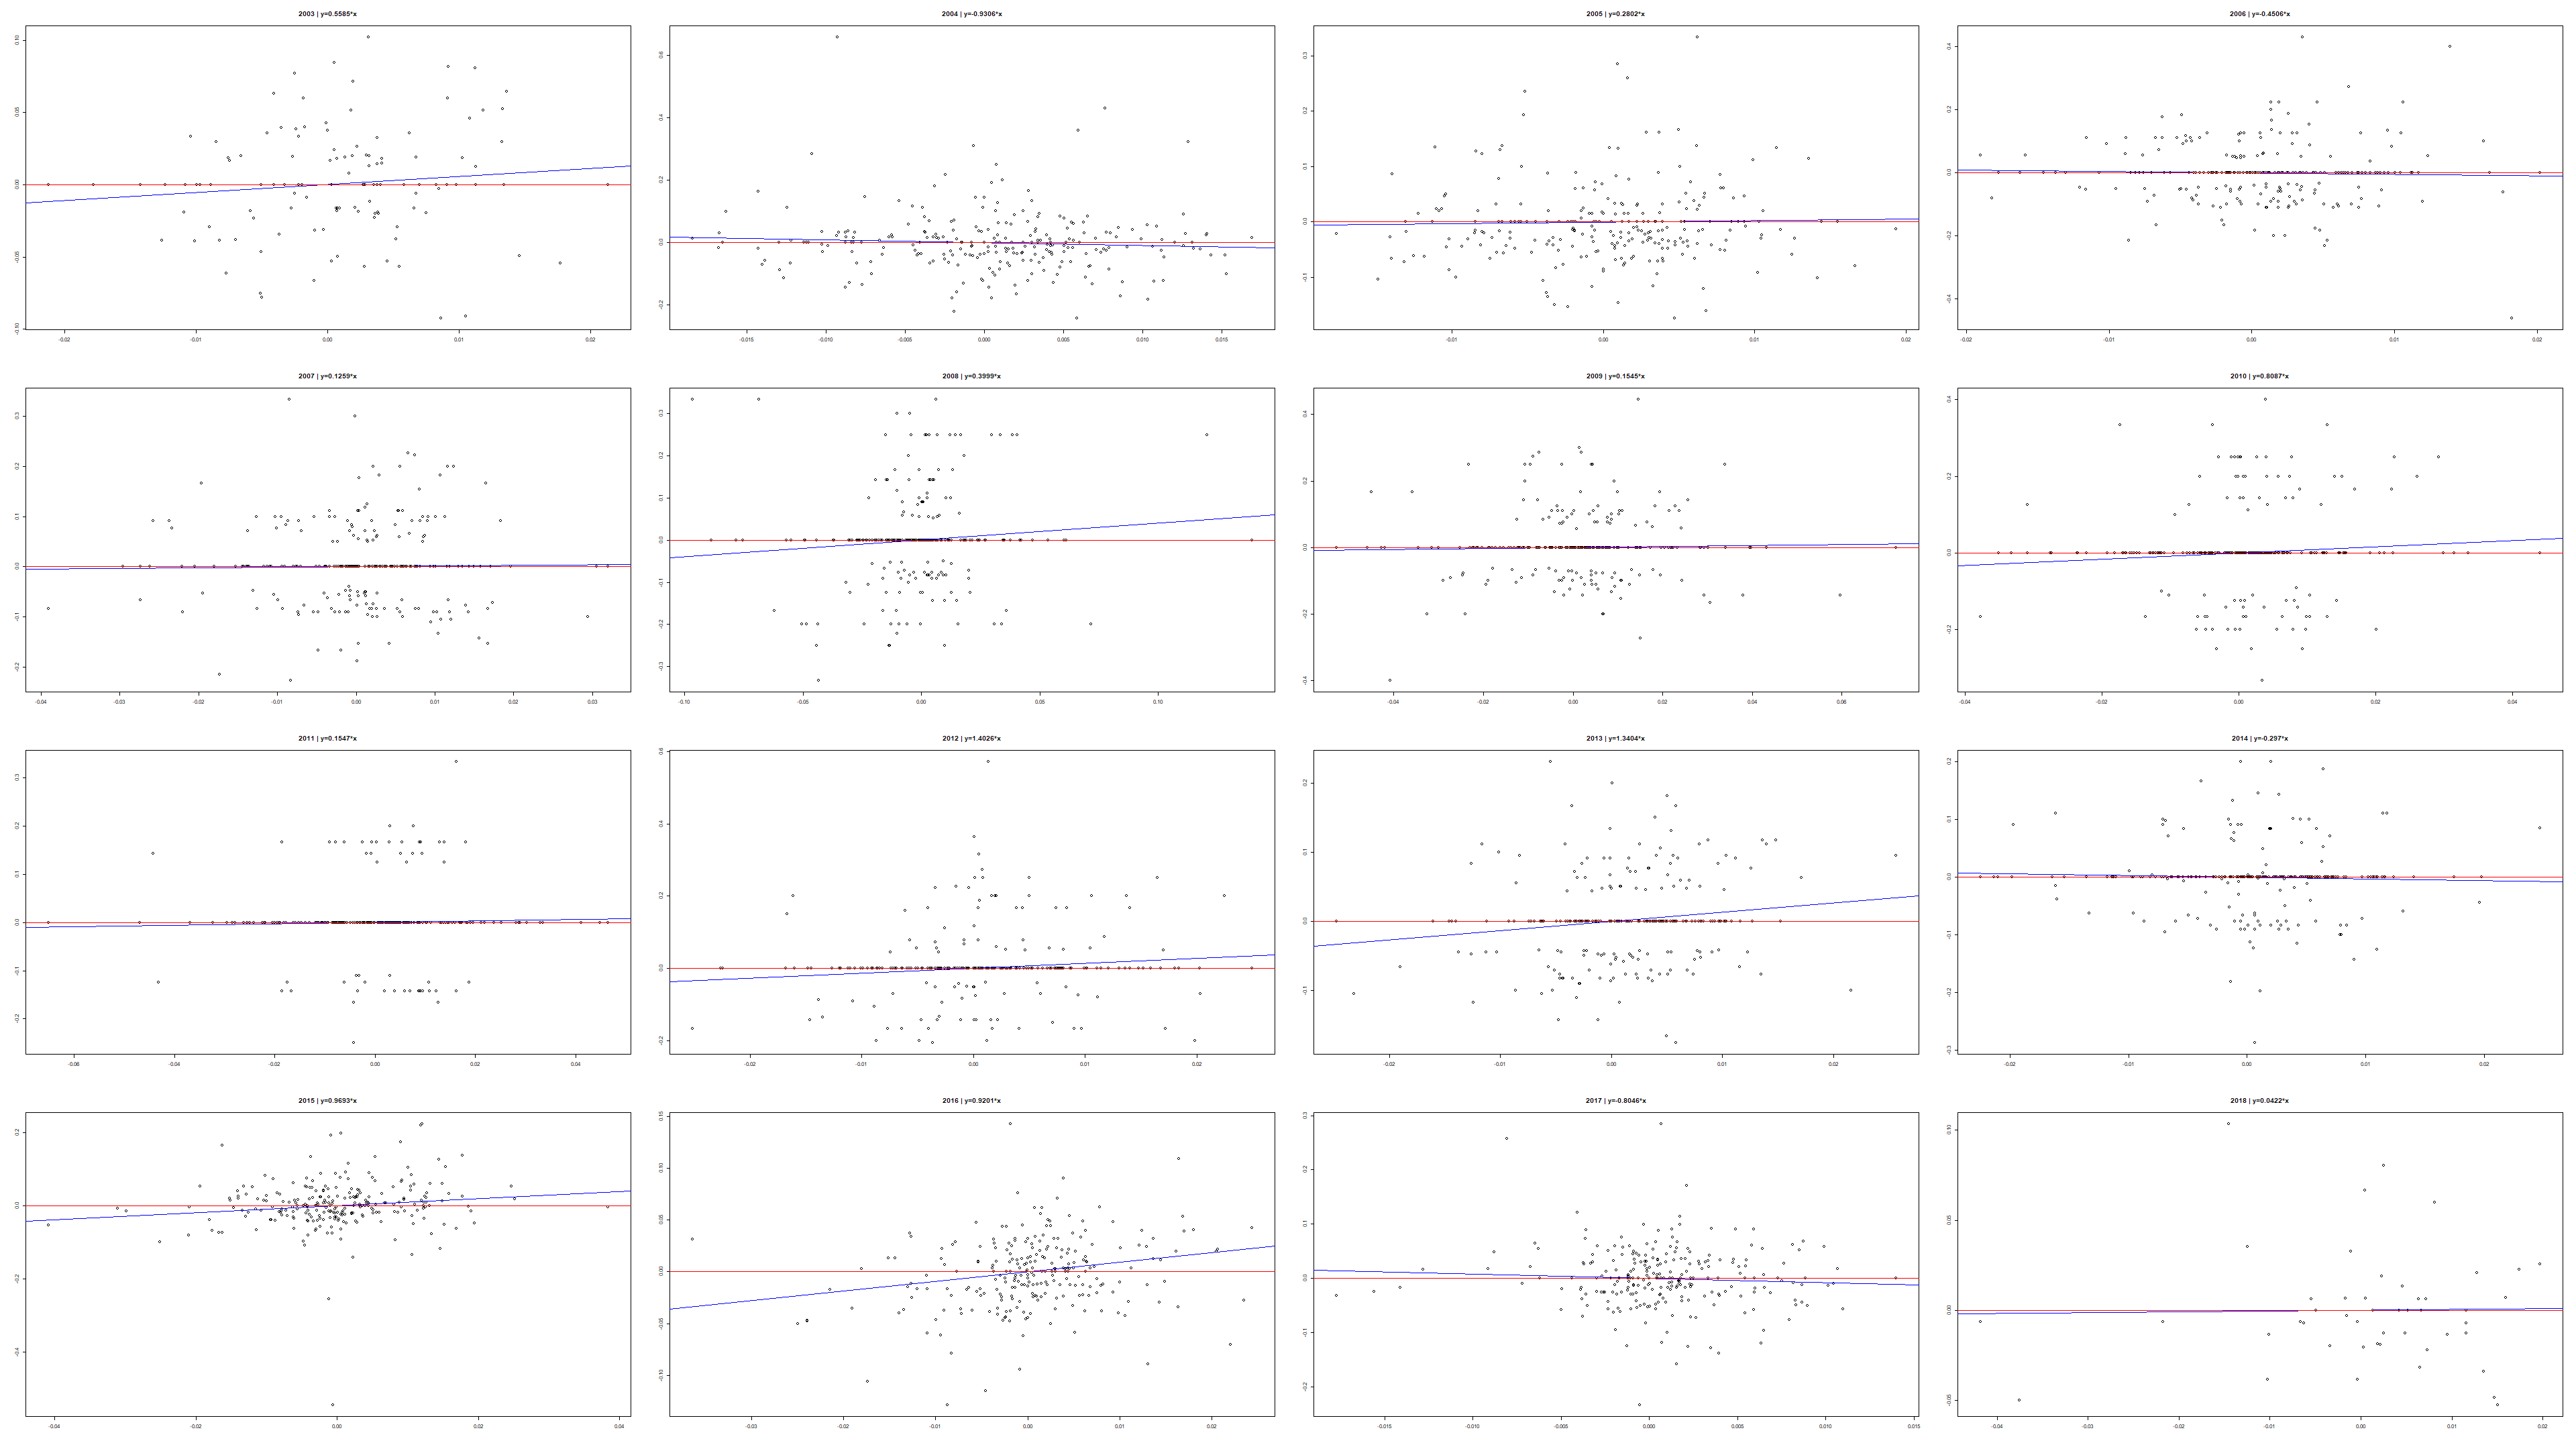
The next step was to scrutinize a currently popular statement that allegedly the stock picking makes nowadays little sense since virtually everything is driven by the macroeconomics. To do this I compute for each stock a linear regression of its daily returns on those of SP 500 (SPY). Since I expect that the regression coefficient does change in time, I compute it for each year separately. I say "it" instead of "them" because it makes sense to supress the intercept (by adding +0 in lm()). The nuance is that the data from Alpha Vantage do have gaps, so one need to collate the dates appropriately.
library(lubridate)
av=av_get(symbol = "SPY", av_fun = "TIME_SERIES_DAILY_ADJUSTED", outputsize = "full")
dv = as.data.frame(av)
zzz = as.xts(dv[,6:7], as.POSIXct(dv$timestamp))
spy=dailyReturn(zzz)
index(spy) = as.Date(index(spy))
L2 = list()
for(k in 2:N)
{
   ya = LST[[k]]
   if(length(ya)<3) next
   possibleError <- tryCatch({
   yb = as.xts(ya[,6:7], as.POSIXct(ya$timestamp))
   yc = dailyReturn(yb)
   index(yc) = as.Date(index(yc))
   jahre = unique(year(index(yc)))
   J = length(jahre)

   pfad3 = paste0(pfad,"/betaSPY/")
   smb = as.character((tickers$ticker)[k])
    nme = as.character((tickers$asset_name)[k])
   png(paste0(pfad3, k,"_",smb, "__", nme,".png"), width=3840, height=2160)
   if((J %% 4) == 0) {
       par(mfrow=c(J/4, 4))
   } else if((J %% 3) ==0) {
       par(mfrow=c(J/3, 3))
   } else {
       par(mfrow=c(J/5+1, 5))
   }
   for(y in 1:J)
   {
     spyDates = index(spy)[which(year(index(spy))==jahre[y])]
     ycDates = index(yc)[which(year(index(yc))==jahre[y])]
     datuemer = intersect(spyDates, ycDates)
     linReg = lm(as.numeric(yc[as.character(as.Date(datuemer))]) ~ as.numeric(spy[as.character(as.Date(datuemer))]) +0)
     beta=round(as.numeric(coef(linReg)), 4)
     plot(as.numeric(spy[as.character(as.Date(datuemer))]), as.numeric(yc[as.character(as.Date(datuemer))]), main=paste0(jahre[y], " | y=",beta,"*x"), xlab="", ylab="")
     abline(linReg,col="blue")
     #points(spy)
     #points(yc, col="blue")
     abline(h=0, col="red")
   }
   dev.off()
   L2[[k]] = yc
   }, error = function(er) {})
  if(inherits(possibleError, "error")) next
}
The results shows that the stock picking is definitely still alive 🙂
Note that I made a mistake, generating the graphs for a 4K (width=3840, height=2160) resolution. I have 4 screens but it is impossible (at least for me) to keep in scope the whole area of a 4K monitor (so I use it on a separate workstation only when I prepare videos for our YouTube channel).
Finally, I made 5000stocks_boxplot_monthlyReturns_BYMONTHS__with_mean_and_SPYreturns and 5000stocks_boxplot_monthlyReturns_with_mean_and_SPYreturns_CUTAT20percent for which I provide no source code because it is too big and, to be true, a little bit clumsy. However, you can definitely write your own code if you are a real quant 🙂
FinViz - an advanced stock screener (both for technical and fundamental traders)