Many "experts", at least in Germany, state nowadays: currently the markets are driven by macroeconomic factors (FED and ECB policies, quantitative easing, etc) thus the stock picking does not make sense. We show that it still does.
In our previous post we have shown how to get from AlphaVantage and to visualize the data on 6356 American stocks. In this post we show how an investor can make use of it.
It is always nice to have diversified portfolio. But as we have previously shown a good diversification does not mean as much stocks in portfolio as possible. Moreover, adding an inappropriate stock to a portfolio may even worsen its diversification! Thus we need to look for weakly correlated stocks. But if the "experts" are right, it should be impossible to find such stocks since all they are allegedly driven by the same macroeconomic factors.
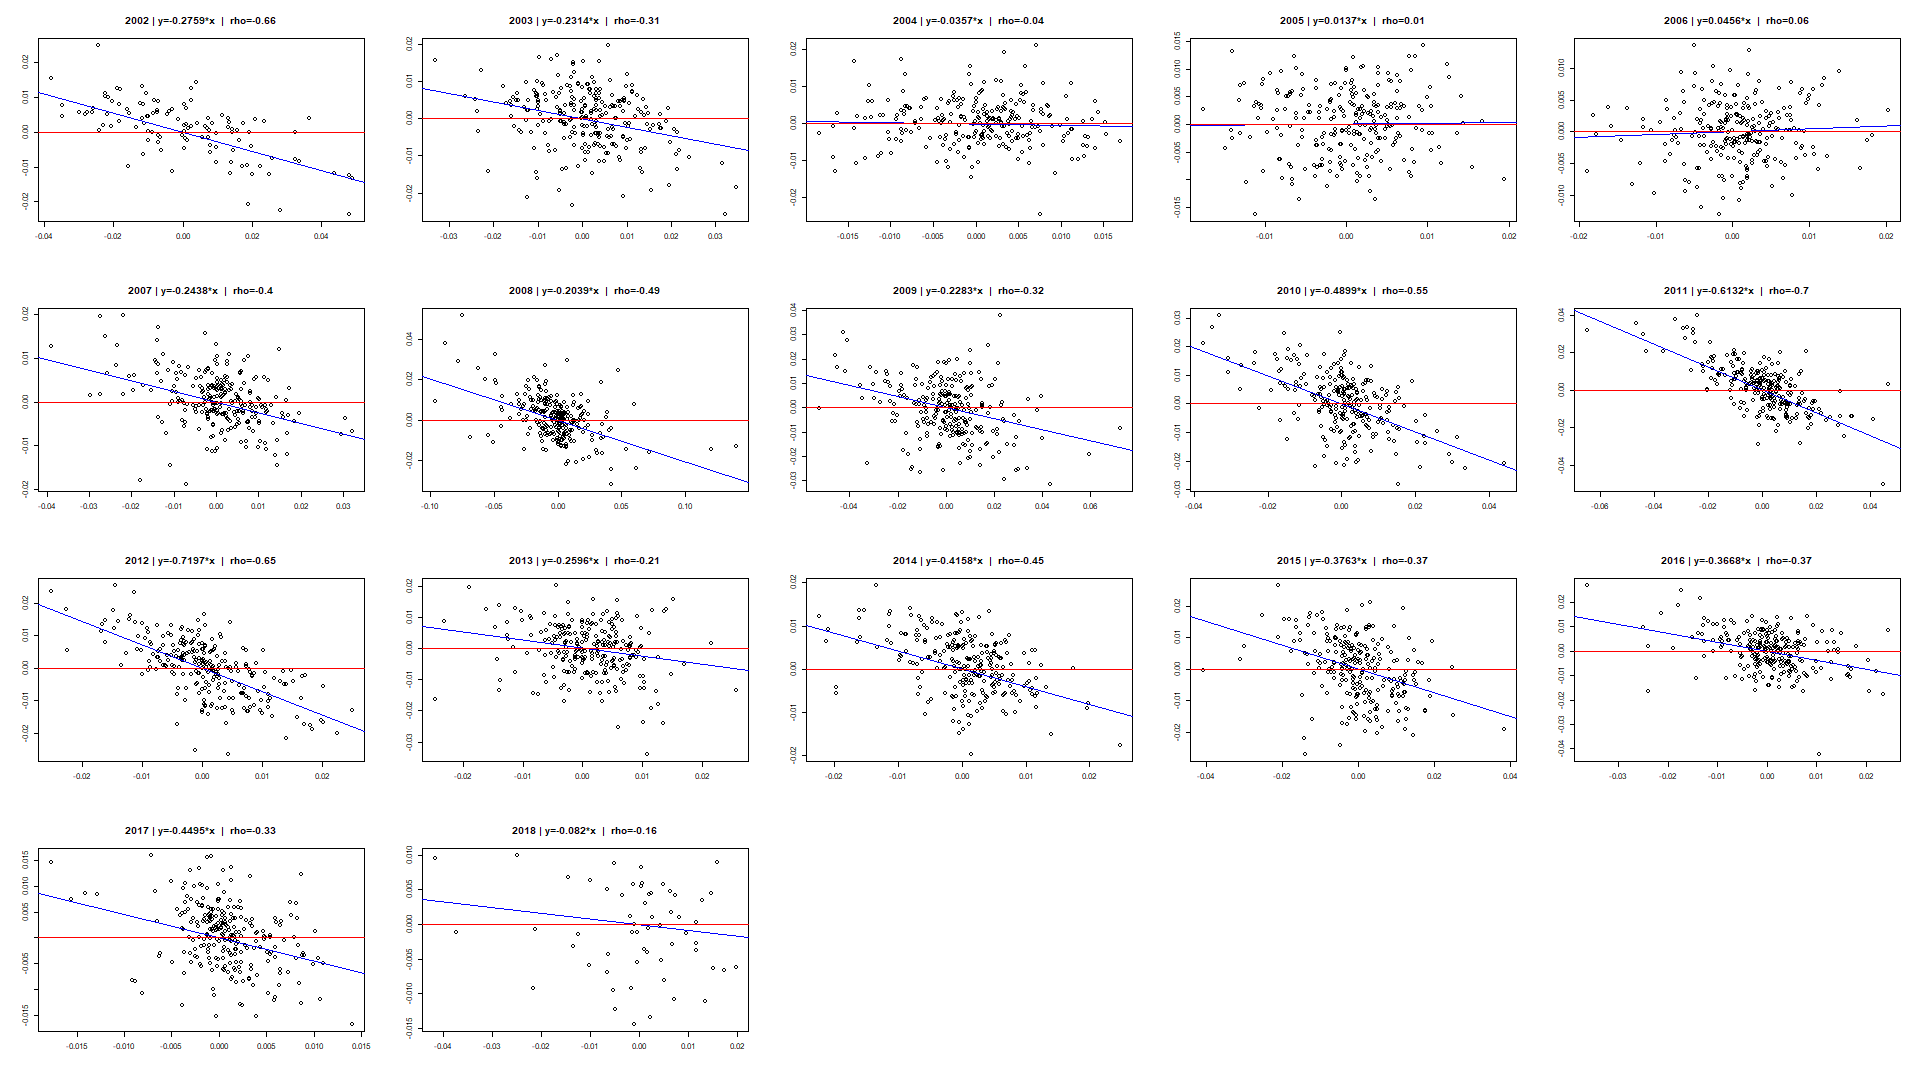
Fortunately, it is pretty easy to check. We could have written an R-script to determine such stocks but indeed we have found them even easier, just screening the scatterplots of stocks and SPY daily returns, enriched with correlation coefficients and regression lines.
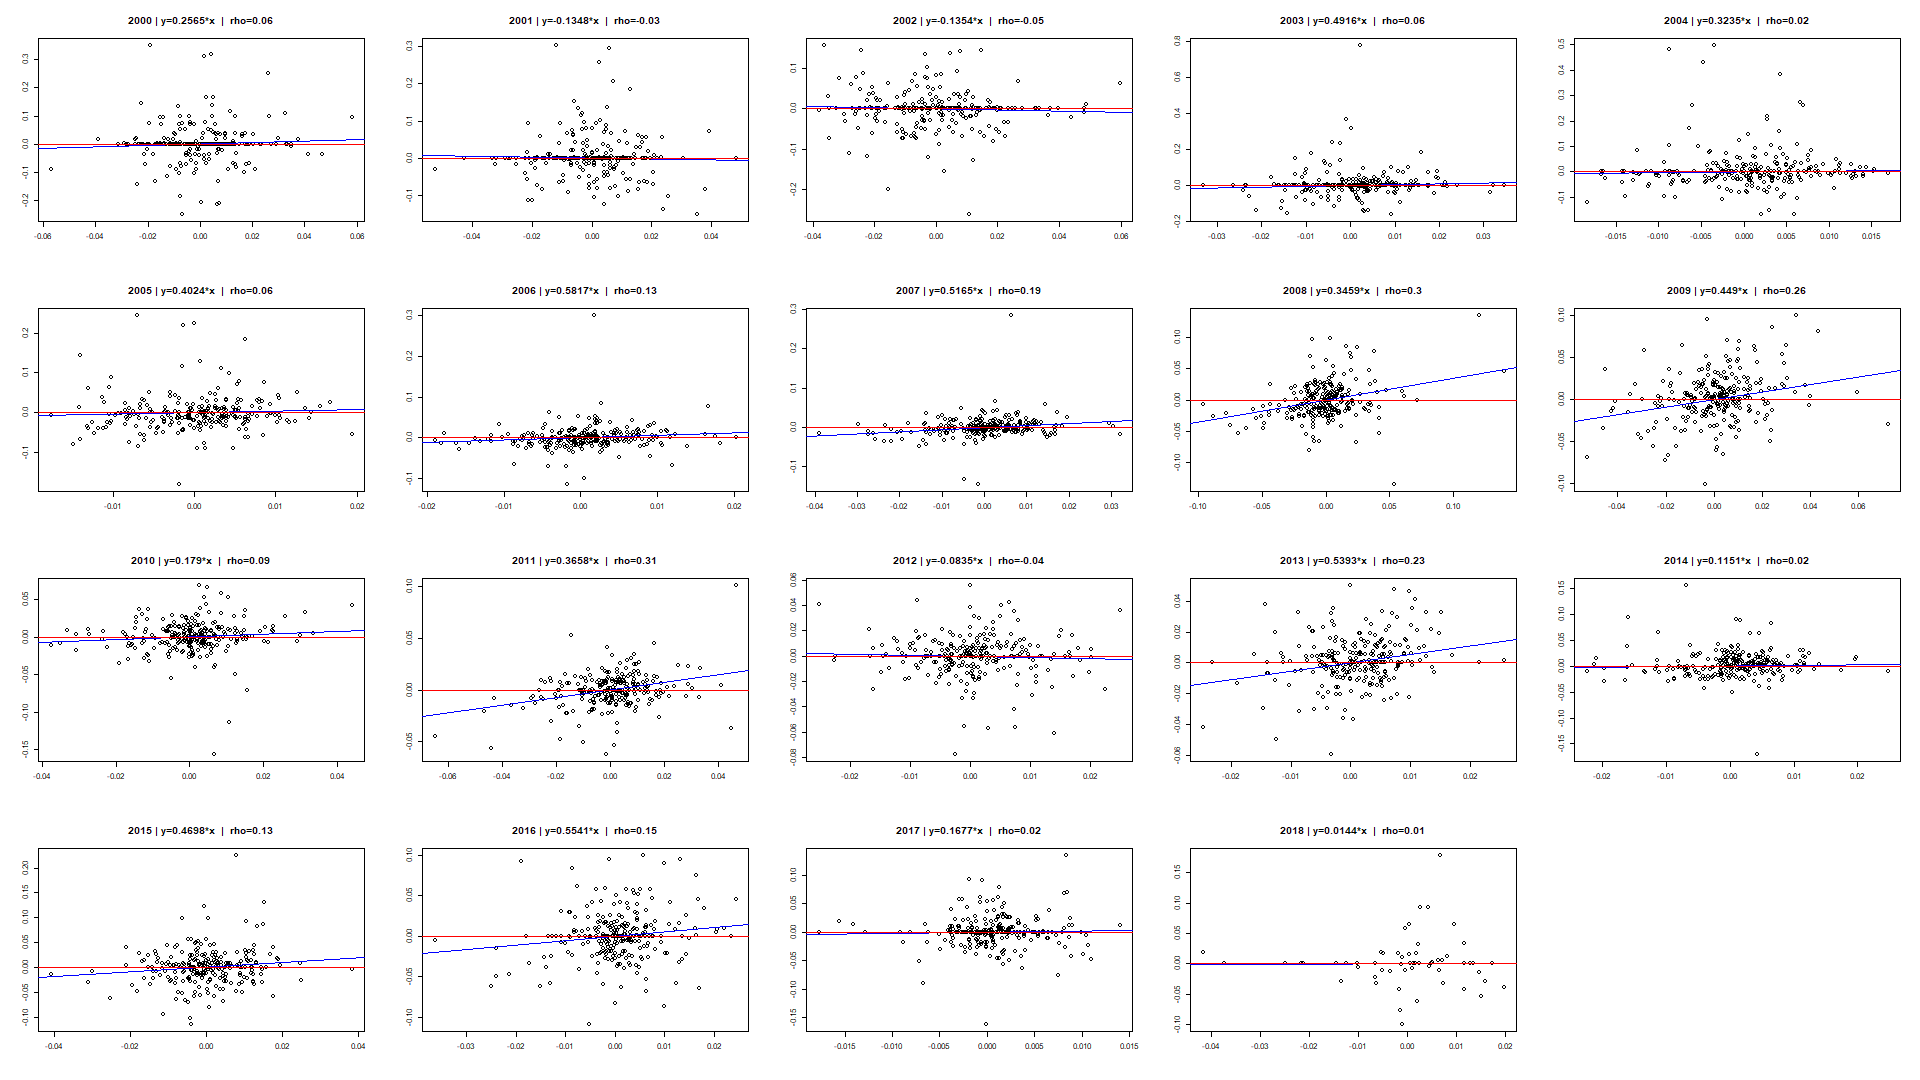
It was not hard to find enough of such stocks, let us consider for instance the following equities:
| Stock Ticker | Company |
| FCCY | 1st Constitution Bancorp |
| CAFD | 8point3 Energy Partners LP |
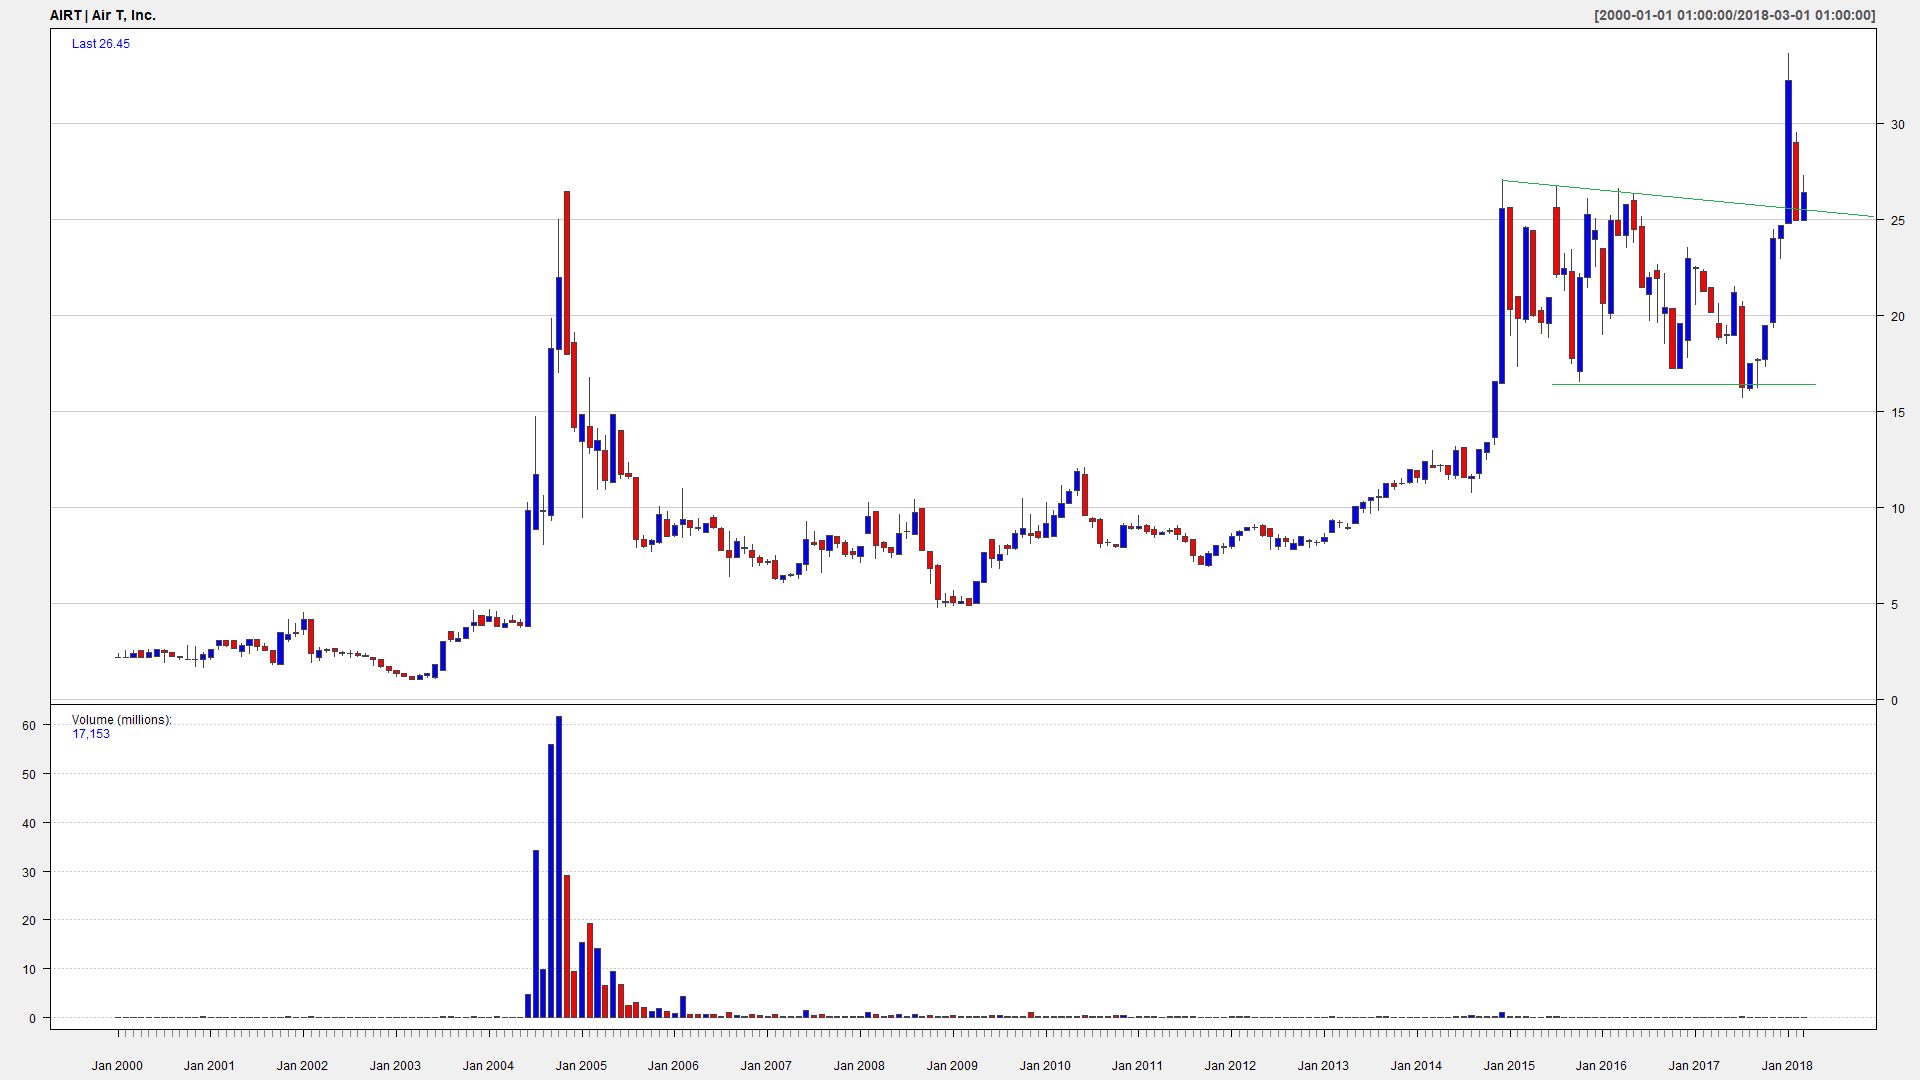
| AIRT | Air T, Inc. |
| ALBO | Albireo Pharma, Inc. |
| ABDC | Alcentra Capital Corporation |
| ALDX | Aldeyra Therapeutics, Inc. |
| ALIM | Alimera Sciences, Inc. |
| ALJJ | ALJ Regional Holdings, Inc. |
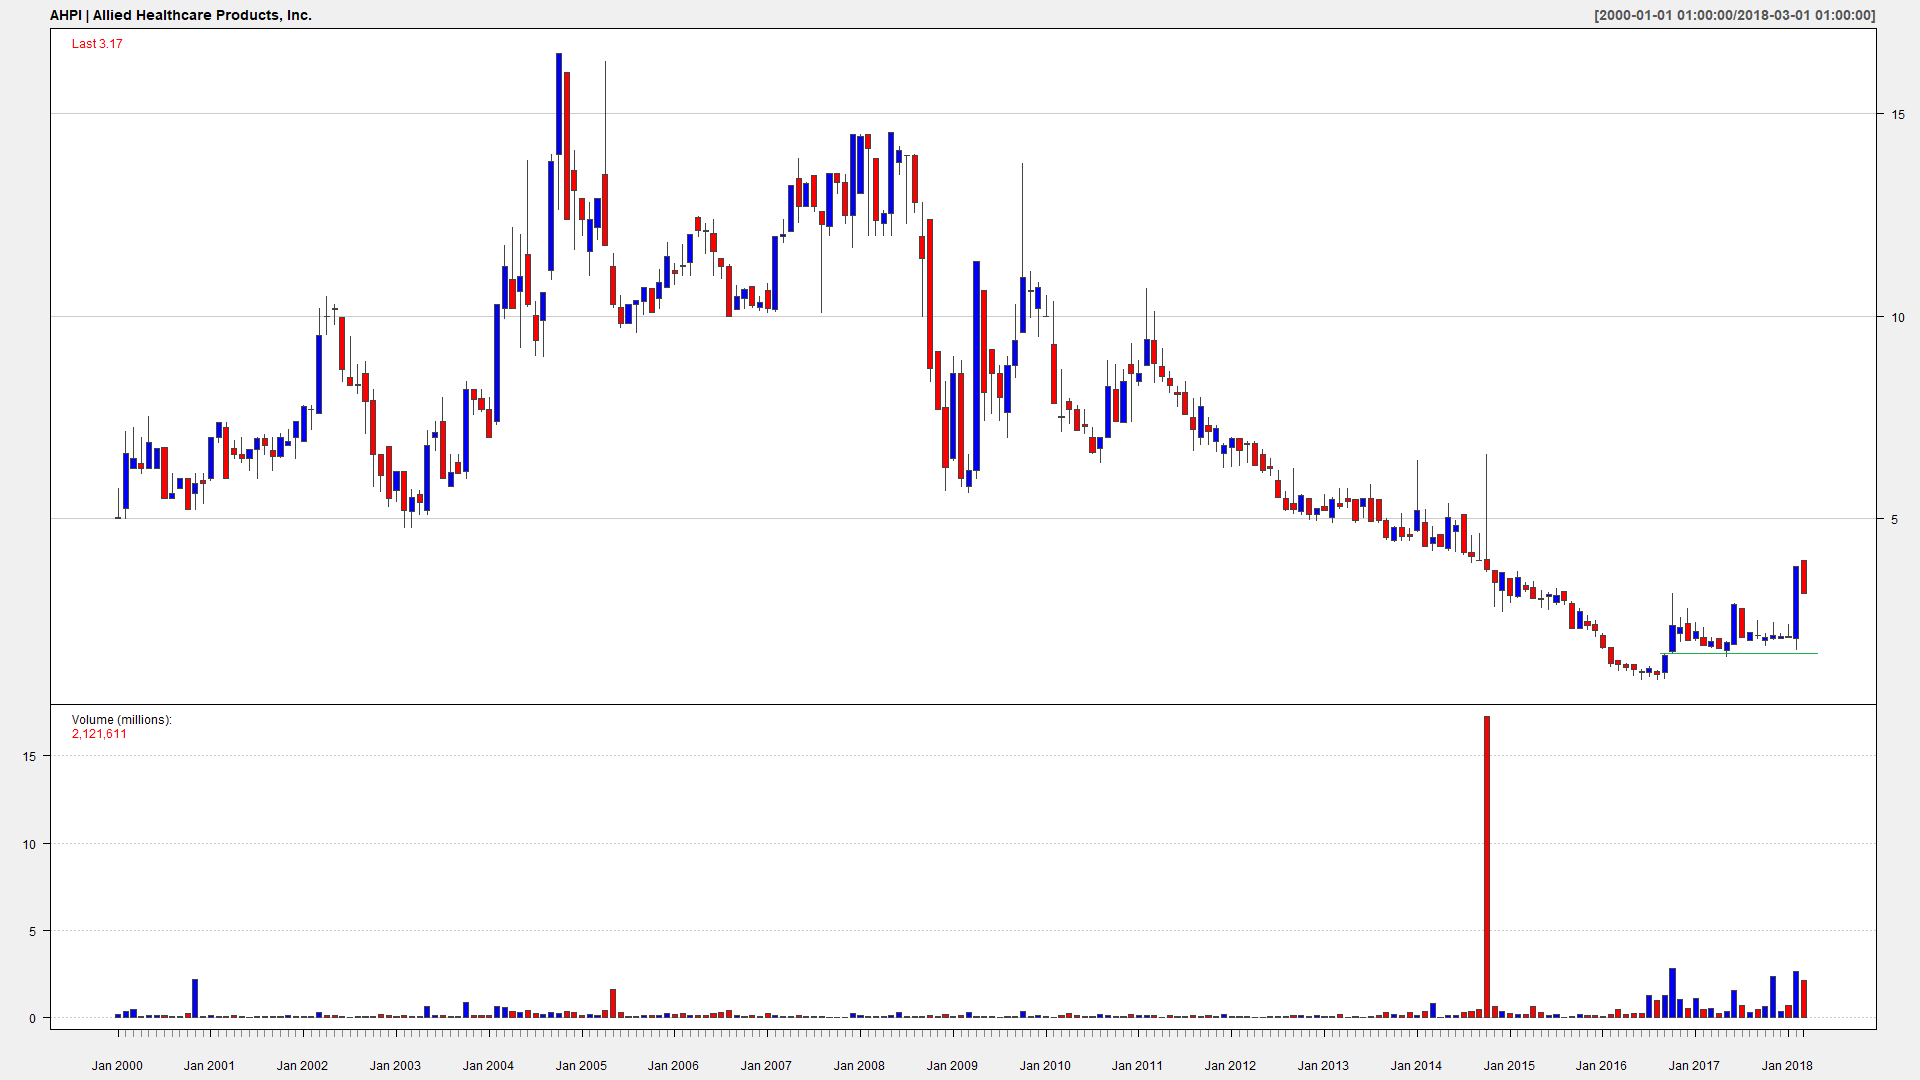
| AHPI | Allied Healthcare Products, Inc. |
| ALQA | Alliqua BioMedical, Inc. |
| APTO | Aptose Biosciences Inc. |
| AQMS | Aqua Metals, Inc. |
| AQXP | Aquinox Pharmaceuticals, Inc. |
| ARDM | Aradigm Corporation |
| SPY | FCCY | CAFD | AIRT | ALBO | ABDC | ALDX | ALIM | ALJJ | AHPI | ALQA | APTO | AQMS | AQXP | ARDM | |
| SPY | 1.00 | 0.16 | 0.26 | 0.15 | 0.19 | 0.28 | 0.06 | 0.23 | 0.10 | 0.09 | 0.18 | 0.10 | 0.14 | 0.28 | 0.08 |
| FCCY | 0.16 | 1.00 | 0.07 | 0.15 | 0.06 | 0.05 | 0.05 | 0.18 | -0.02 | 0.05 | 0.08 | 0.02 | 0.05 | -0.03 | 0.02 |
| CAFD | 0.26 | 0.07 | 1.00 | 0.07 | 0.13 | 0.13 | 0.03 | 0.12 | 0.05 | -0.05 | 0.14 | -0.03 | 0.03 | 0.07 | 0.06 |
| AIRT | 0.15 | 0.15 | 0.07 | 1.00 | 0.14 | 0.14 | 0.00 | 0.08 | -0.06 | -0.04 | 0.19 | 0.05 | 0.00 | -0.01 | 0.00 |
| ALBO | 0.19 | 0.06 | 0.13 | 0.14 | 1.00 | 0.05 | 0.11 | 0.17 | -0.09 | 0.04 | 0.08 | -0.12 | 0.03 | 0.09 | 0.03 |
| ABDC | 0.28 | 0.05 | 0.13 | 0.14 | 0.05 | 1.00 | 0.06 | 0.12 | 0.03 | 0.13 | 0.10 | 0.16 | 0.08 | 0.03 | 0.10 |
| ALDX | 0.06 | 0.05 | 0.03 | 0.00 | 0.11 | 0.06 | 1.00 | 0.12 | 0.05 | 0.02 | 0.12 | 0.03 | 0.18 | 0.11 | 0.11 |
| ALIM | 0.23 | 0.18 | 0.12 | 0.08 | 0.17 | 0.12 | 0.12 | 1.00 | 0.12 | 0.12 | 0.08 | 0.09 | 0.00 | 0.16 | 0.04 |
| ALJJ | 0.10 | -0.02 | 0.05 | -0.06 | -0.09 | 0.03 | 0.05 | 0.12 | 1.00 | 0.02 | -0.03 | 0.09 | 0.00 | 0.04 | 0.11 |
| AHPI | 0.09 | 0.05 | -0.05 | -0.04 | 0.04 | 0.13 | 0.02 | 0.12 | 0.02 | 1.00 | 0.06 | 0.03 | 0.01 | 0.05 | -0.12 |
| ALQA | 0.18 | 0.08 | 0.14 | 0.19 | 0.08 | 0.10 | 0.12 | 0.08 | -0.03 | 0.06 | 1.00 | -0.01 | 0.05 | 0.02 | -0.04 |
| APTO | 0.10 | 0.02 | -0.03 | 0.05 | -0.12 | 0.16 | 0.03 | 0.09 | 0.09 | 0.03 | -0.01 | 1.00 | 0.03 | -0.01 | 0.04 |
| AQMS | 0.14 | 0.05 | 0.03 | 0.00 | 0.03 | 0.08 | 0.18 | 0.00 | 0.00 | 0.01 | 0.05 | 0.03 | 1.00 | 0.11 | 0.09 |
| AQXP | 0.28 | -0.03 | 0.07 | -0.01 | 0.09 | 0.03 | 0.11 | 0.16 | 0.04 | 0.05 | 0.02 | -0.01 | 0.11 | 1.00 | 0.13 |
| ARDM | 0.08 | 0.02 | 0.06 | 0.00 | 0.03 | 0.10 | 0.11 | 0.04 | 0.11 | -0.12 | -0.04 | 0.04 | 0.09 | 0.13 | 1.00 |
But can we rely on historical data? Well, at least in this case likely yes, since
| SPY | FCCY | CAFD | AIRT | ALBO | ABDC | ALDX | ALIM | ALJJ | AHPI | ALQA | APTO | AQMS | AQXP | ARDM | |
| SPY | 1.00 | 0.11 | 0.08 | 0.02 | 0.13 | 0.18 | 0.02 | 0.16 | 0.21 | 0.03 | 0.09 | 0.07 | 0.18 | 0.25 | 0.03 |
| FCCY | 0.11 | 1.00 | -0.02 | 0.01 | -0.01 | 0.02 | 0.03 | 0.09 | 0.05 | 0.06 | 0.07 | 0.01 | -0.04 | 0.04 | 0.10 |
| CAFD | 0.08 | -0.02 | 1.00 | -0.03 | 0.10 | 0.08 | 0.04 | 0.11 | -0.09 | 0.03 | -0.01 | 0.05 | 0.01 | 0.16 | 0.08 |
| AIRT | 0.02 | 0.01 | -0.03 | 1.00 | 0.16 | 0.16 | 0.02 | 0.03 | -0.04 | 0.10 | 0.08 | 0.00 | 0.11 | 0.05 | 0.07 |
| ALBO | 0.13 | -0.01 | 0.10 | 0.16 | 1.00 | 0.03 | 0.03 | 0.14 | 0.04 | -0.04 | -0.01 | 0.03 | 0.10 | 0.02 | 0.03 |
| ABDC | 0.18 | 0.02 | 0.08 | 0.16 | 0.03 | 1.00 | 0.01 | 0.09 | -0.01 | 0.09 | 0.19 | -0.02 | 0.12 | 0.05 | -0.02 |
| ALDX | 0.02 | 0.03 | 0.04 | 0.02 | 0.03 | 0.01 | 1.00 | 0.06 | -0.03 | 0.00 | 0.00 | 0.06 | 0.01 | 0.05 | 0.03 |
| ALIM | 0.16 | 0.09 | 0.11 | 0.03 | 0.14 | 0.09 | 0.06 | 1.00 | 0.06 | 0.11 | -0.01 | 0.03 | 0.18 | 0.16 | 0.14 |
| ALJJ | 0.21 | 0.05 | -0.09 | -0.04 | 0.04 | -0.01 | -0.03 | 0.06 | 1.00 | 0.11 | 0.00 | 0.01 | 0.12 | 0.25 | 0.03 |
| AHPI | 0.03 | 0.06 | 0.03 | 0.10 | -0.04 | 0.09 | 0.00 | 0.11 | 0.11 | 1.00 | -0.04 | -0.04 | 0.01 | 0.16 | -0.01 |
| ALQA | 0.09 | 0.07 | -0.01 | 0.08 | -0.01 | 0.19 | 0.00 | -0.01 | 0.00 | -0.04 | 1.00 | 0.06 | 0.02 | 0.00 | 0.14 |
| APTO | 0.07 | 0.01 | 0.05 | 0.00 | 0.03 | -0.02 | 0.06 | 0.03 | 0.01 | -0.04 | 0.06 | 1.00 | 0.10 | 0.02 | 0.04 |
| AQMS | 0.18 | -0.04 | 0.01 | 0.11 | 0.10 | 0.12 | 0.01 | 0.18 | 0.12 | 0.01 | 0.02 | 0.10 | 1.00 | 0.15 | 0.06 |
| AQXP | 0.25 | 0.04 | 0.16 | 0.05 | 0.02 | 0.05 | 0.05 | 0.16 | 0.25 | 0.16 | 0.00 | 0.02 | 0.15 | 1.00 | 0.06 |
| ARDM | 0.03 | 0.10 | 0.08 | 0.07 | 0.03 | -0.02 | 0.03 | 0.14 | 0.03 | -0.01 | 0.14 | 0.04 | 0.06 | 0.06 | 1.00 |
It is also important not just to look at the correlation matrices (which become hardly legible from a certain size) but also to look at pairwise-scatterplots.
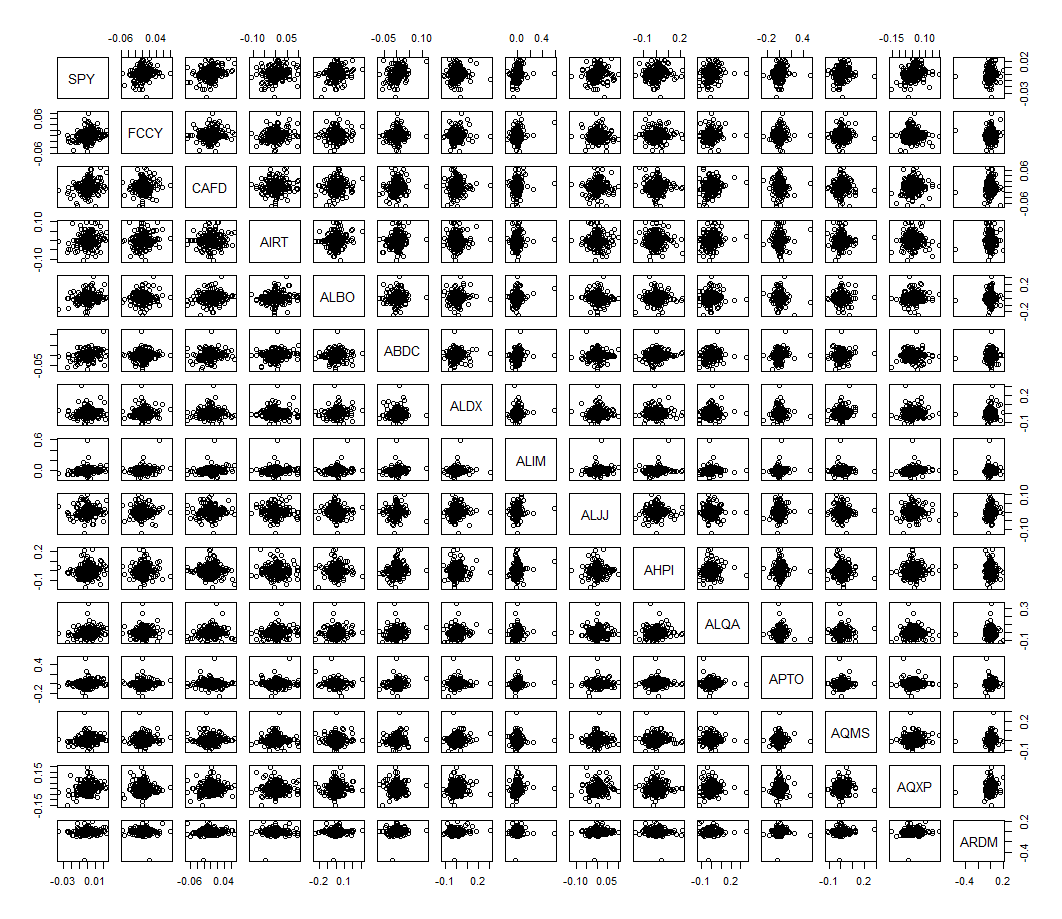
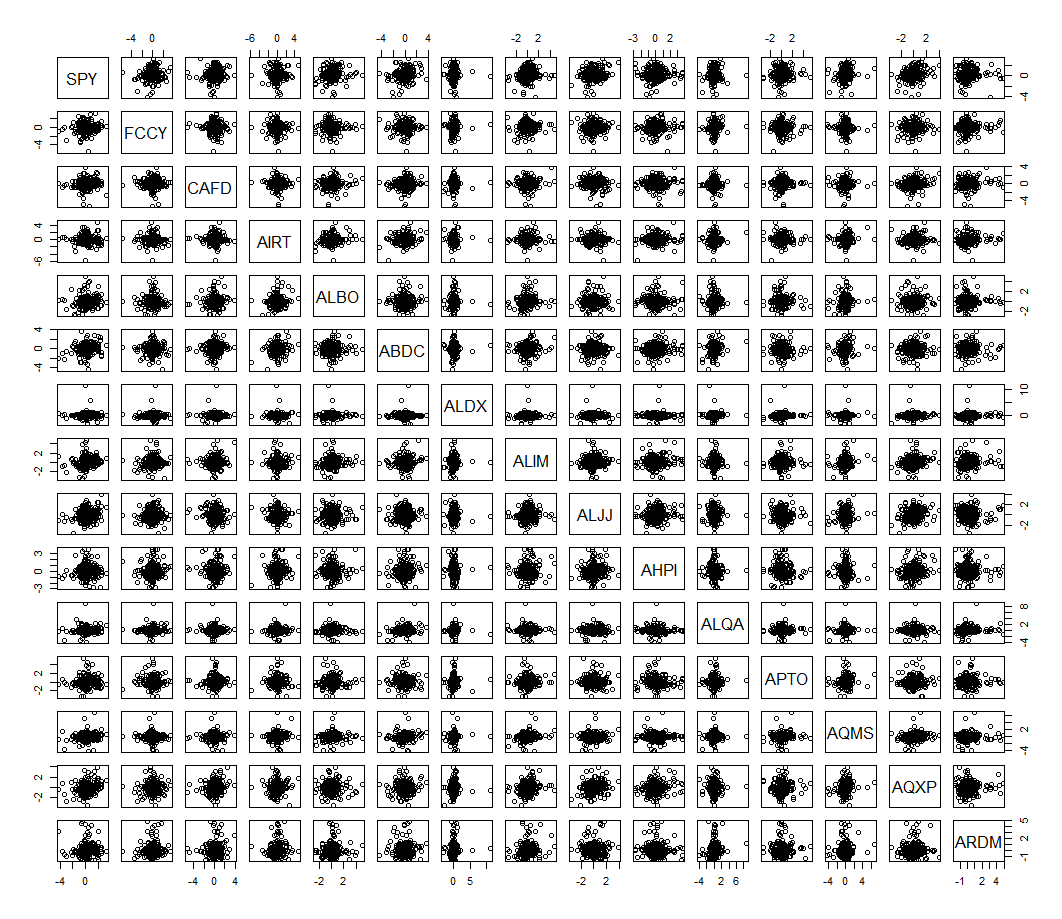
These scatterplots allow you to see the tail dependence (how the stocks co-move in extreme cases) and the outliers (the latter are readily visible e.g. for ALIM, ARDM, AQMS thus the data for these stocks should be double-checked).
Note that most of these stocks are Bioscience and Pharma. But first of all we just did a quick search, so if you want to additionally diversify between the branches, from 6356 stocks you will likely be able to choose from different economic sectors. Secondly, you see that the stocks even from the same sector can be weekly correlated!
Anyway, we found uncorrelated stocks, now what? Well, now it is your job to look for the chances among these stocks! And finding them you may be sure that your trades are (more or less) market-neutral. But are (or were) there any trading opportunities by these stocks? Yes (and also have a look at FinViz).
P.S. TLT is a Bond-ETF but speaking about the correlations with SPY I feel the thrust to show you the scatterplot of SPY and TLT. Some educated but lazy investors that I know in person hold their reserves in cash, since (in Germany) reigns a zero interest-rate. But in USA fortunately not! And a position in TLT not only brings you a virtually riskless return but also diversifies your stock portfolio!
Disclaimer: Currently we do not hold any position in above-mentioned stocks.
FinViz - an advanced stock screener (both for technical and fundamental traders)