StockPup.com generously shares the fundamental data for several hundred stocks. However, there are a lot of outliers and missing data. We present some interesting results for the market summary and the long-term trends.
The fundamental data are normally updated at quarterly basis, so let us first have a look at the summary statistics of the quarterly stock returns. It is as follows
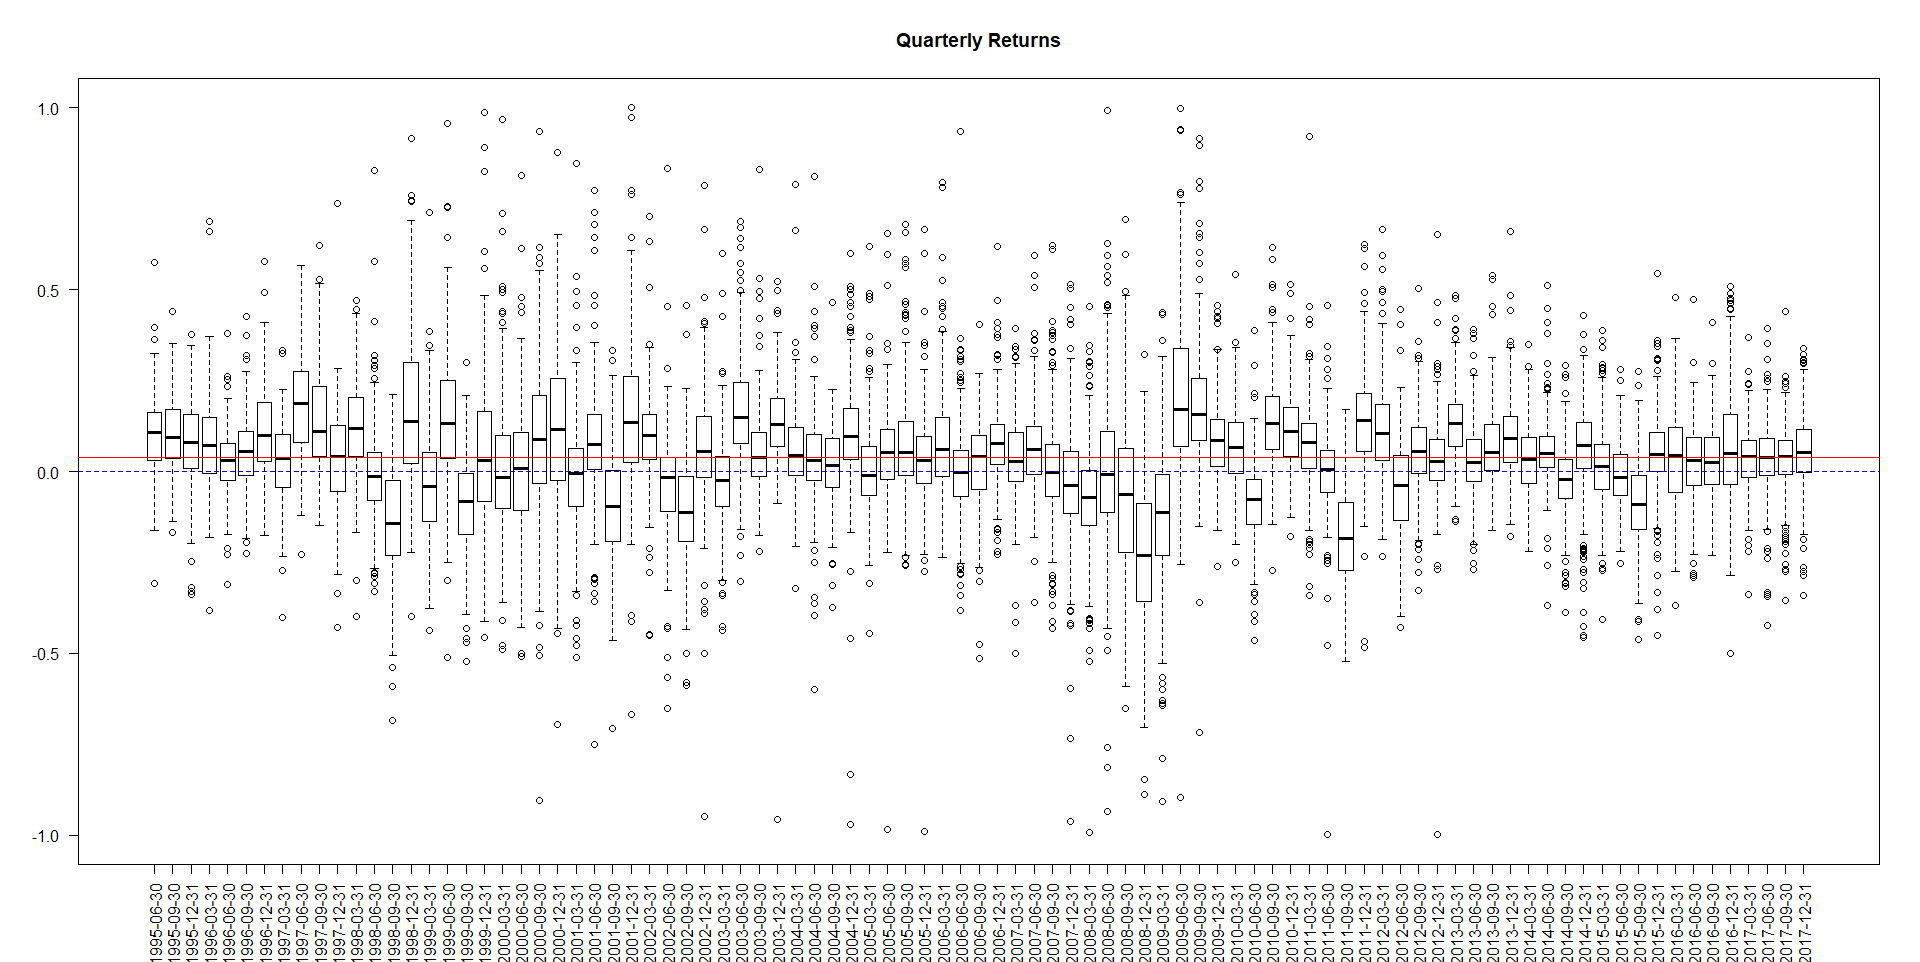
In particular, you can readily see that the for the last 9 quarters the median of returns was positive... and very close to the long term median quarterly return (red line).
So far, so good but let us have a look at the return on equity (RoE)
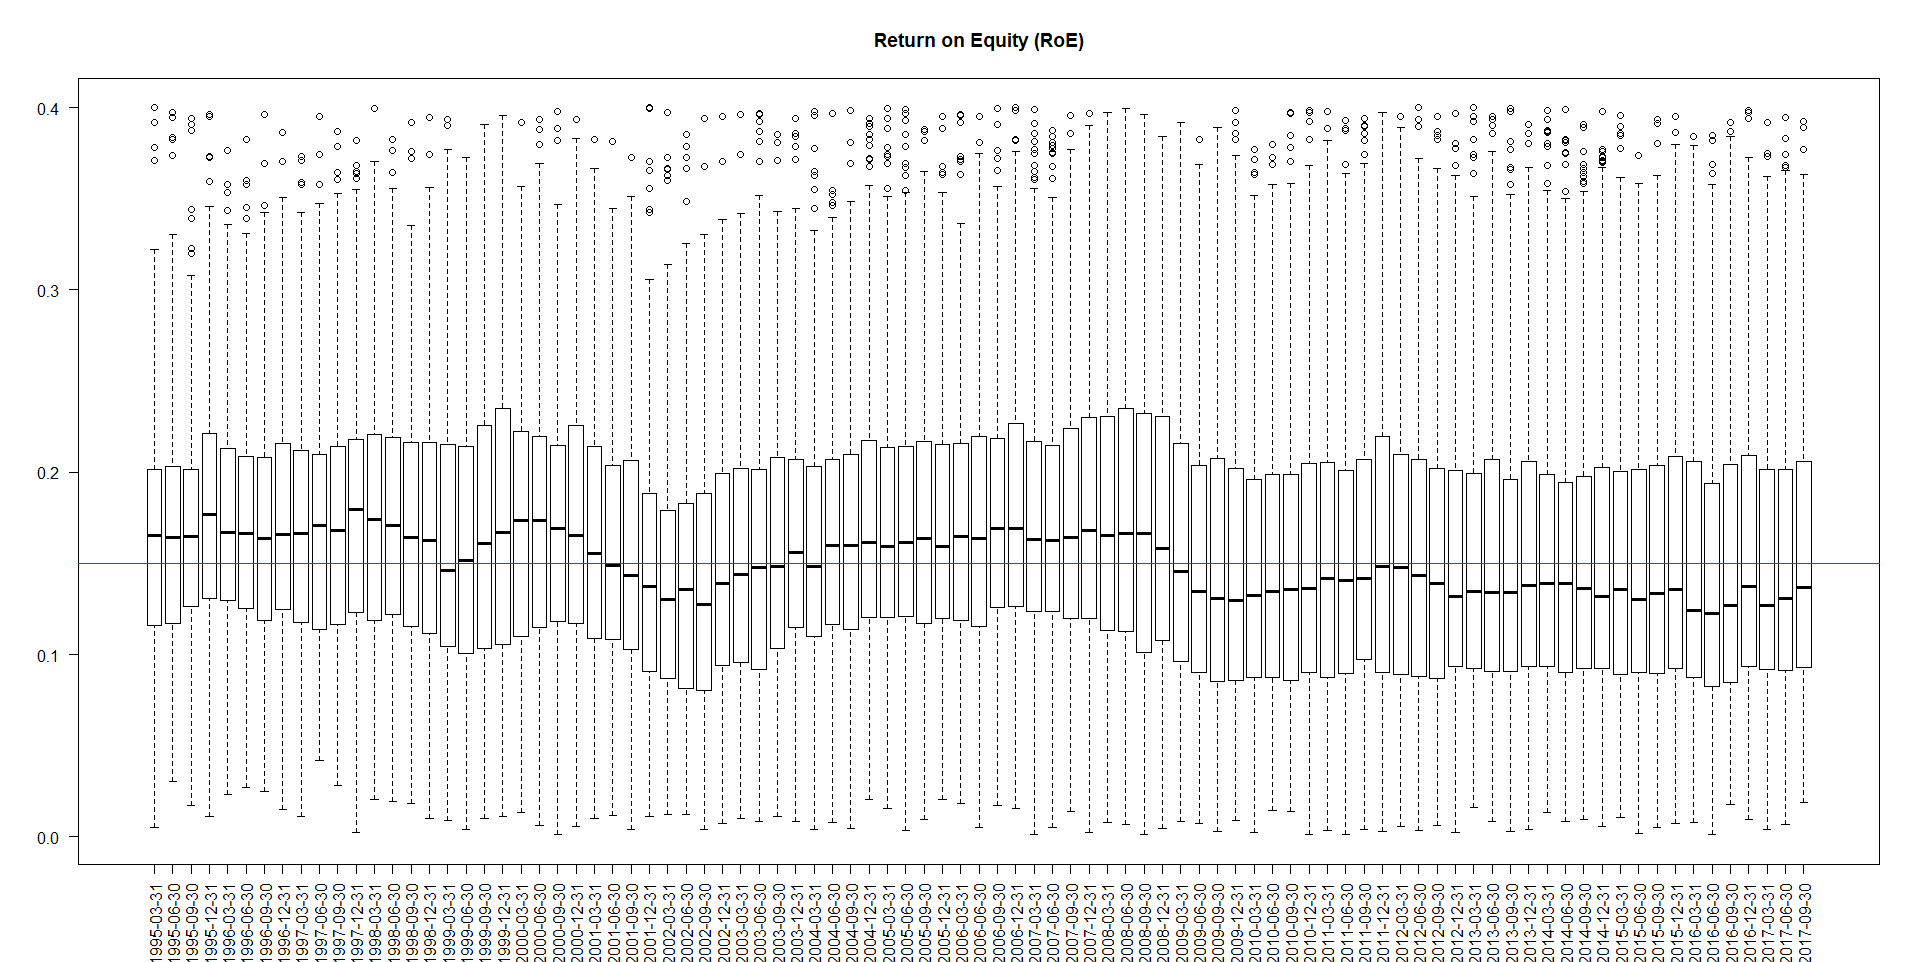
On can recognize a kind of cyclic structure and nowadays the RoE is not on the crest of wave, although for the latest 3 quarters the dynamics is positive.
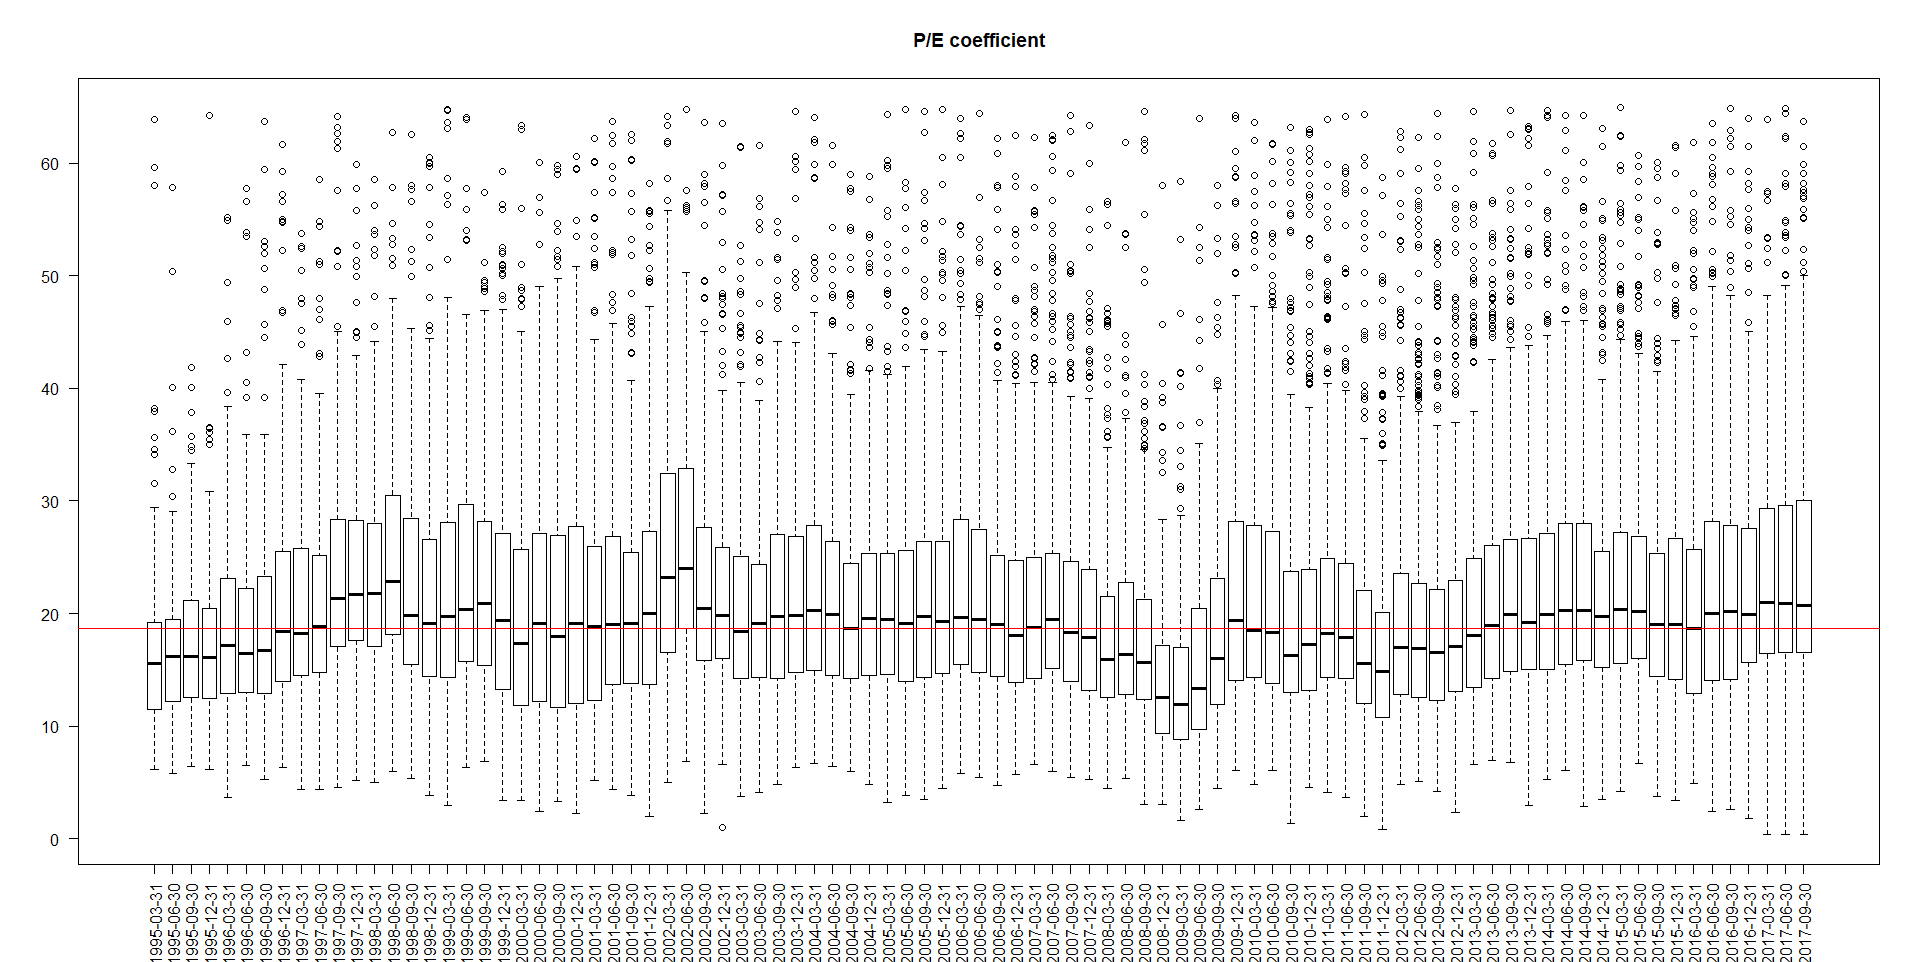
How about the P/E ratio? It is above average median, not a very good sign for me.
Last but not least you can readily see that the Equity to Assets Ratio tends to decrease.
Also not a good sign.

Likely, this quick overview raises more questions rather than it gives the answers.
Additionally, there is some selection bias: the stocks in different quarters are not necessarily the same due to missing data and filtered outliers. However, there are reasons to consider the market fundamentally (somewhat) overheated. As to me, I am going to patiently wait till the end of the current market correction (hopefully, it will be just a correction, not a crash) and than look at the the summary market statistics again.
ALTERSARMUT VERHINDERN: Eine Praktische Anleitung
FinViz - an advanced stock screener (both for technical and fundamental traders)