The maximum drawdown (MDD) is likely the most important measure of risk in practice. We explain how to calculate it and why you should keep it under control. Remember, if the MMD reaches -50% the portfolio have to grow +100% in order just to compensate the previous loss!
1. What is a drawdown
Suppose you want to measure the riskiness of a portfolio (maybe even your trading portfolio). There are several concepts to do this like volatility, expected shortfall, value at risk. In this short article we will introduce the drawdown as a measure for risk.
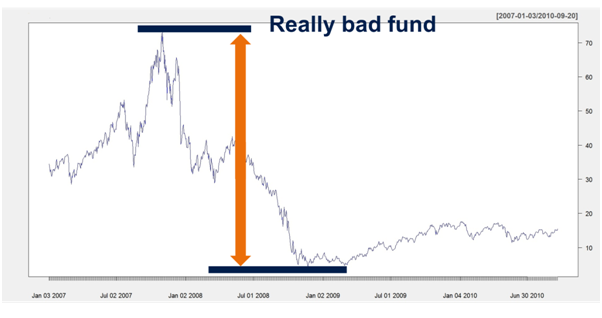
For illustration purposes let’s look at the following chart of a real fund. We don’t want to name the fund since we don’t want to badmouth anybody although the poor performance would justify this.

We immediately recognize the distinctive peak around 75$ as well as the low point around 5$. The difference between these values is called the maximum drawdown since it is the largest of all possible differences between a high and low for this fund within the time frame. So in this case we would have
Maximum Drawdown = 75$ - 5$ = 70$
This is an absolute figure and of course it makes sense to scale it by the value of the absolute high. So the maximum drawdown then is the of the difference between the all-time high and the all-time low and the all-time high
Maximum Drawdown= 70$ / 75$ = 0.933
So for the really bad fund we have a Maximum Drawdown of around 93% which is a scary figure.
2. Why do drawdowns matter?
The magnitude of drawdowns that have occurred so far tells you a lot about your portfolio or fund. The point is that the recuperation from a severe loss (i.e. drawdown) normally takes a lot of time.
For instance, look at the previous chart. The Maximum Drawdown is around 93%. Of course we selected the example to for illustrative purposes. Normally, drawdowns are somewhat smaller. But let’s ask the question much the fund has to gain in order to just recuperate from such a loss. It would take at least a 14 fold increase to accomplish this! How did we came to this conclusion? The calculation is quite simple since in order to get back to 100% the following equation must hold
x(100%-93%) = 100%
which leads to x ≈ 14.3.
Now let’s go a step further and ask, how long it would actually take to recuperate from such a loss. For this let’s assume that the fund has a cumulated asset growth rate (CAGR) of 15%. This is actually a very good result that only few funds manage to achieve.
It would take a staggering 19 years to recuperate from such a drawdown. This can be calculated quite easily since we must have the following
and therefore y ≈ 19 years. If you bought this fund around the all-time high you can basically forget about it (but miracles happen from time to time, right?).
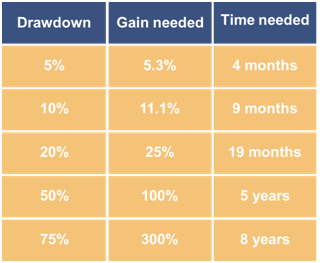
Now you have a first idea of the interplay between the maximum drawdown growth rate and time. Let’s look at these relationships more closely. The following table gives an overview about the drawdown, the time gain needed to recuperate and the time needed for this (here we again assume a CAGR of 15%).

FinViz - an advanced stock screener (both for technical and fundamental traders)
