As I promised you in my previous article I am back with a review of a Stock Trading Simulator that works in Excel and does not suffer from the mentioned drawbacks that hamper all other available free simulators.
Apologies for the long time gap since my earlier post, but I wanted to provide you with the very latest version of the Simulator described below, which substantially improves upon the original version.
It is a spreadsheet called DsTradingSimulator.xlsm that you can download for free from https://www.deriscope.com/freedownload.php. The only prerequisite is that you have previously installed the free Deriscope Excel Add-In – downloaded from the same site as above - that equips your Excel session with a wizard that allows you to fetch live data from various providers and also perform various financial calculations.
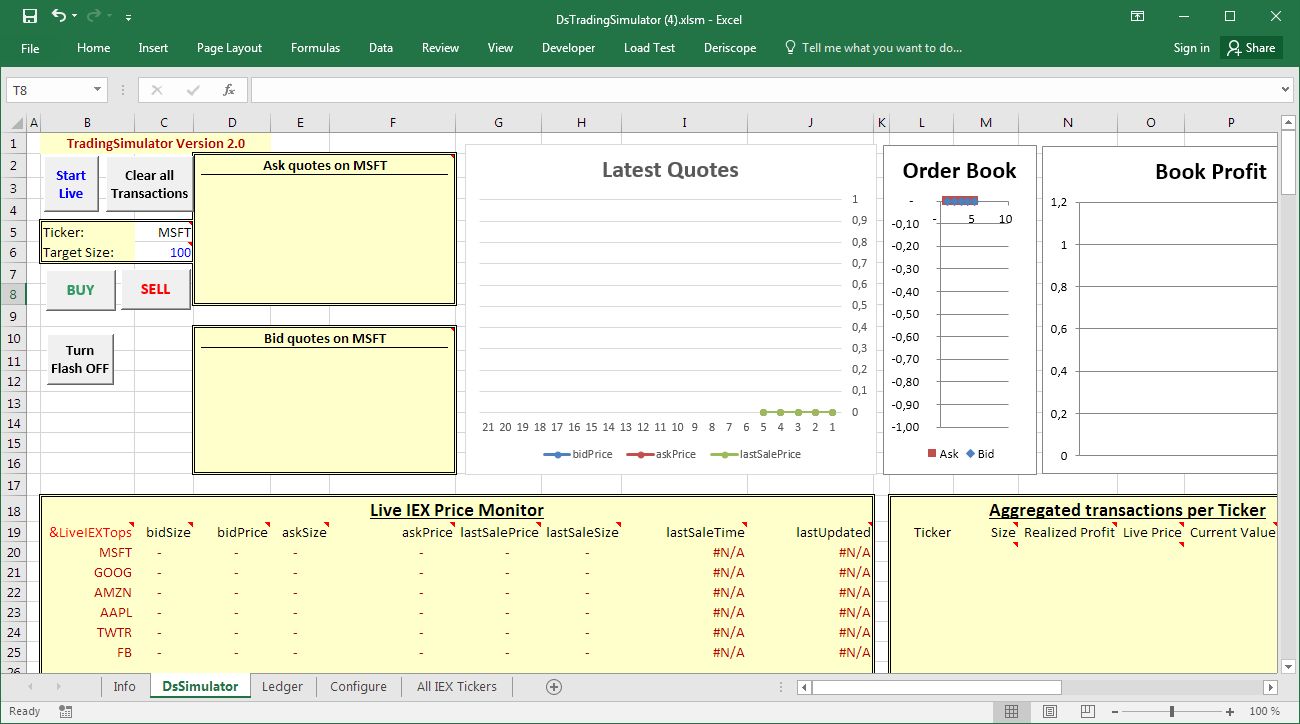
When you open the spreadsheet, the sheet named "DsSimulator" will look like that:
If your Excel is in automatic calculation mode, it is likely that errors will appear on the various cells due to Deriscope not being yet enabled.
Deriscope will be enabled and live feeds will keep coming as soon as you click on the "Start Live" button. You can control the frequency of the incoming live feeds at the sheet named "Configure" under the "Takt" label.
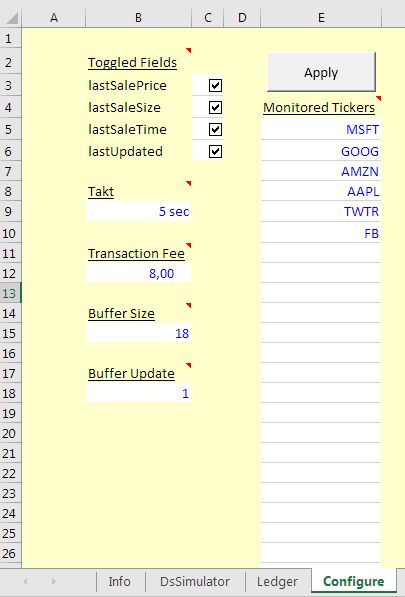
The default is set to 5 seconds, but you can set it as fast as 1 second, if you do not mind risking an … epileptic attack due to the very fast flashing of the cells where the live feeds arrive! (See picture below) There is an anti-epileptic button though that you can use to thwart flashing while feeds keep coming. It is on the "DsSimulator" sheet and displays the label "Turn Flash OFF". Apart from its … anti-epileptic properties, turning off flashing also protects your Excel native undo history from being constantly erased, as each single flash has the unfortunate side-effect of erasing Excel's undo history!
The important aspect here is that live feeds are NOT time delayed! They are coming straight from IEX (the Investors Exchange) and provide you with the actual prices of the selected stocks. In particular the yellow area under "Live IEX Price Monitor" reports the current best bid, best offer and last traded price on each stock ticker listed on the left column. In addition, all respective sizes (number of shares) are also reported plus the timestamp of the last trade and the timestamp of the live feeds generation on the IEX server side. The next screenshot shows how the spreadsheet looks like during typical operation:

If you remember from my previous article, the two main drawbacks of all other free Trading Simulators are a) the substantial time lag with which the market prices are reported and b) the lack of bid/offer prices. As you see, the Deriscope Trading Simulator solves both of these problems.
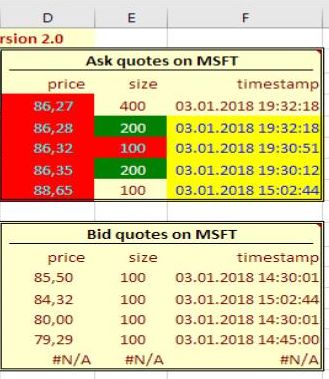
As a matter of fact, Deriscope goes one step further and provides you not only with the non-delayed best bid/offer prices, but also with the complete so called "Deep Order Book" that includes the quotes for the non-best bid/offer prices and respective sizes! These quotes are displayed in the two tables under "Ask quotes on XYZ" and "Bid quotes on XYZ" shown below, where XYZ is the stock ticker selected for the impending BUY or SELL transaction.
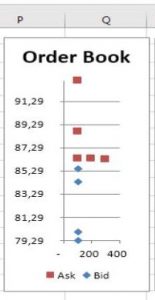
The chart below titled "Order Book" provides a visual depiction of the Order Book that gets refreshed at each live feeds tick.
Any decent Trading Simulator would be incomplete without a time series chart of most recent stock prices. While most Simulators provide you with a time series of last traded prices that end with the price quoted 20 minutes ago, Deriscope includes a chart of all three quote types – bid, ask and trade price – that extend up to the time of the last received feed (see below).
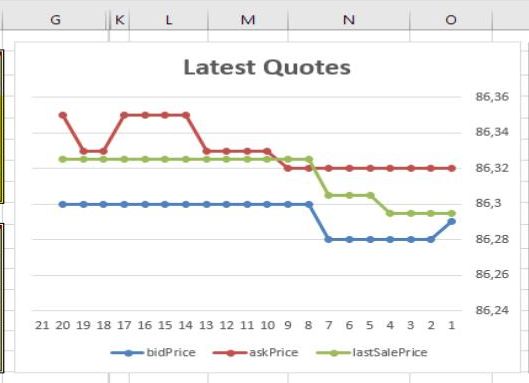
You can even customize the total number of received feeds collected and retained in memory as well as the collection frequency (which may differ from the live feeds update frequency) in the "Configure" sheet. The quotes are then "poured", as soon as they are received, in the yellow area under the "Latest quotes" label as shown below.
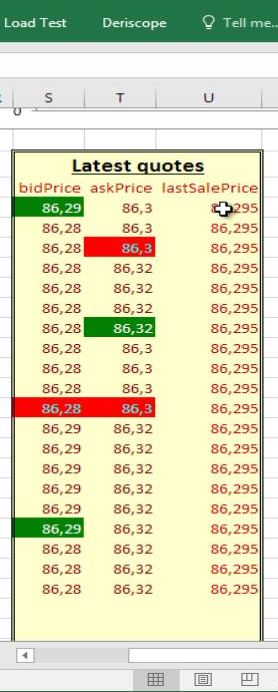
Apart from the visual aid rendered by the respective chart - also titled "Latest Quotes" -, the raw spreadsheet numbers offer themselves to your inventive custom UDFs or VB code that may be deployed towards calculating trading signals, basically BUY or SELL recommendations based on the time series of past prices.
So no expensive software or advanced programming techniques are required for you to implement your own algorithmic trading! If your VB skills are good enough for creating an Excel UDF, then you can create a UDF that – for example - returns TRUE if the last 3 prices are below the long term average minus the running standard deviation. The forthcoming Deriscope version will even provide you with special VB commands that can be employed in your VB code to replicate programmatically the clicking of the BUY and SELL buttons! These commands will then let you write your own custom VB code that also executes trades on your behalf as soon as your own custom trading signals dictate to do so. In effect, you will then have a fully-fledged trading robot, of which the efficacy and consistency can be tested on real market conditions!
You are not restricted on placing orders on one ticker only. You may select any ticker out of those displayed in the Live Monitor area, enter the desired trading size and then press either the BUY or SELL button. Afterwards the details of the undertaken transaction are permanently recorded in the "Ledger" sheet (picture below).
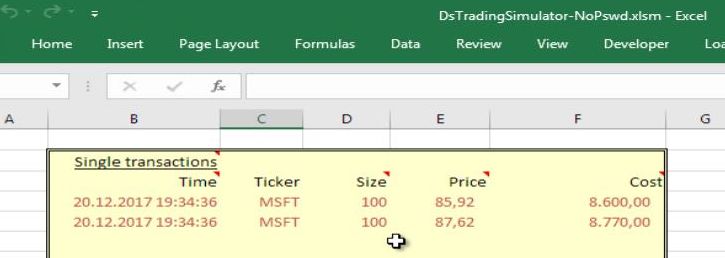
As you keep placing BUY and SELL orders on various stocks, the Ledger keeps expanding, but you can conveniently see you aggregate positions on each stock as well as you total P&L at the table under the "Aggregated transactions per Ticker" label. Both the realized and total (book) P&L is reported. The respective chart titled "Book Profit" is a visual report on your current P&L position (picture below).
![]()
Below are two video tutorials I have published so far.
The first video shows how trading activity is done in the original version of the Trading Simulator. The second video introduces the second improved version and focuses on working with the time series of most recent feeds.
Overview of the Deriscope Trading Simulator
Deriscope Trading Simulator version 2
Feel free to contact me if you want to share any thoughts with me with regard to this product or if you want me to add any particular features. Contact info and social media links are available at my web site https://www.deriscope.com
On my next post I will describe a similar spreadsheet that acts as a Forex Trading Simulator. Currency trading is a bit idiosyncratic and therefore requires its own separate spreadsheet, as I will explain in that post.
FinViz - an advanced stock screener (both for technical and fundamental traders)