In my last post I showed you how to use the Deriscope Stock Trading Simulator Excel spreadsheet to place simulated BUY and SELL market orders on US stocks traded on IEX (the Investors Exchange). In this post I will guide you through another Excel spreadsheet called DsTradingSimulatorFX.xlsm that you can also download for free. This new spreadsheet allows you to place simulated BUY and SELL orders on specific currencies based on real time bid/offer quotes supplied by the TrueFX live feeds provider. As usually, the only prerequisite is that you have previously installed the free Deriscope Excel Add-In – downloaded from the same site as above - that equips your Excel session with a wizard that allows you to fetch live data from various providers and also perform various financial calculations.
The reason I create a different spreadsheet for Currency trading lies partly on the following differences between Stock and Currency trading:
- Liquidity: Currency trading is much more liquid than Stock trading. This is primarily due to the nature of currencies as an economy-wide transaction asset but also to the limited number of currencies as opposed to stocks as well as the worldwide distribution of banks and brokerages that regularly engage in currency trading activities.
- Volatility: Forex short term volatility is much higher than Stock short term volatility. Over a time interval of a few minutes fx rates fluctuate much more dramatically than stock prices. Over longer time intervals though, fx rates tend to stay within a narrow price regime as they represent the relative strengths of the respective countries' underlying economies. Since a country's economic strength is roughly the average of its companies' strengths, it follows that it must be overall less volatile than the average's constituents, i.e. the stocks of that country. The higher short term Forex volatility is solely due to its higher liquidity, i.e. the abundance of traders who are willing to trade currencies.
- Hours of Operation: FX trading is generally possible 24 hours a day, whereas stocks can only be traded during business hours.
- Bid/Offer structure: Stocks are traded in centralized exchanges where the market maker maintains a book of bid/offer quotes constantly supplied by the various market participants. Effectively all bid/offer quotes are consolidated in a single list, which is then published from a central source, the exchange. Currencies are generally traded in a decentralized fashion by various worldwide brokers who publish their own bid/offer quotes. For example Deriscope displays the quotes received from TrueFX, which in turn represent the quotes of the particular broker chosen by TrueFX at any particular time. Therefore there is no “Deep Order Book” involved, as was the case with the Stock Trading Simulator. No size either, as most brokers only publish the prices at which they are willing to buy and sell currencies.
- Brokerage Fee: Contrary to Stock brokers, most Forex brokers execute your orders without imposing a fee as their profit comes from the spread between the bid and offer prices they quote.
- Involvement of Denomination Currency: Stocks are traded in a particular exchange (such as IEX), without an explicit mention of the currency at which the bid/offer quotes are denominated, as this is by default the domestic currency of the country where the exchange is located. On the other hand, currencies are traded all over the world and therefore it is not clear what the denomination currency should be. For example, IEX may report the price of MSFT (Microsoft) as 88.20, meaning 88.20 $, but a Forex broker cannot report the price of EUR as 1.2029 because it would not be clear whether this should mean 1.2029 $ or 1.2029 £ or something else! The solution is that Forex brokers employ the convention of reporting the denomination currency immediately after the traded currency, quoting for example as follows: EUR/USD at 1.2029
- Stock Tickers vs Currency Pairs: This follows from the role played by the Denomination Currency as described above. In effect, a so called Currency Pair – such as EUR/USD – assumes the role a ticker – such as MSFT – plays in stock trading. In Forex trading jargon you can buy or sell a Currency Pair but not a single currency! The traded currency is referred to as the "Base Currency", whereas the denomination currency is referred to as the "Quote Currency". For example in the pair EUR/USD, EUR -> Base Currency and USD -> Quote Currency.
- Short Selling: Short Selling refers to a sell order on a traded asset that you do not already own. Most exchanges either disallow or place restrictions on short selling of stocks. On the other hand Short Selling in currency markets is always allowed due to the following: Selling the Base Currency is equivalent to buying the Quote Currency, so that disallowing Short Selling would amount to disallowing regular buying, which would lead to cessation of all trading activities!
- Quote Conventions: Stock prices are quoted as they are, for example 20 for MSFT (meaning you must pay 88.20 $ in order to receive one MSFT share). Rates for currency pairs may still be quoted as they are, for example 1.2029 for EUR/USD (meaning you must pay 1.2029 $ in order to receive one unit of EUR currency), but more often they are split into two parts called Big and Pip. In the mentioned EUR/USD example, the Big part is 1.20 and the Pip part is 29. Some brokers do not even publish the Big part as it almost never changes over regular time intervals. Deriscope reports both Big and Pip parts as well as the full quotes.
When you open the Deriscope spreadsheet, the sheet named "DsSimulator" will look like that:
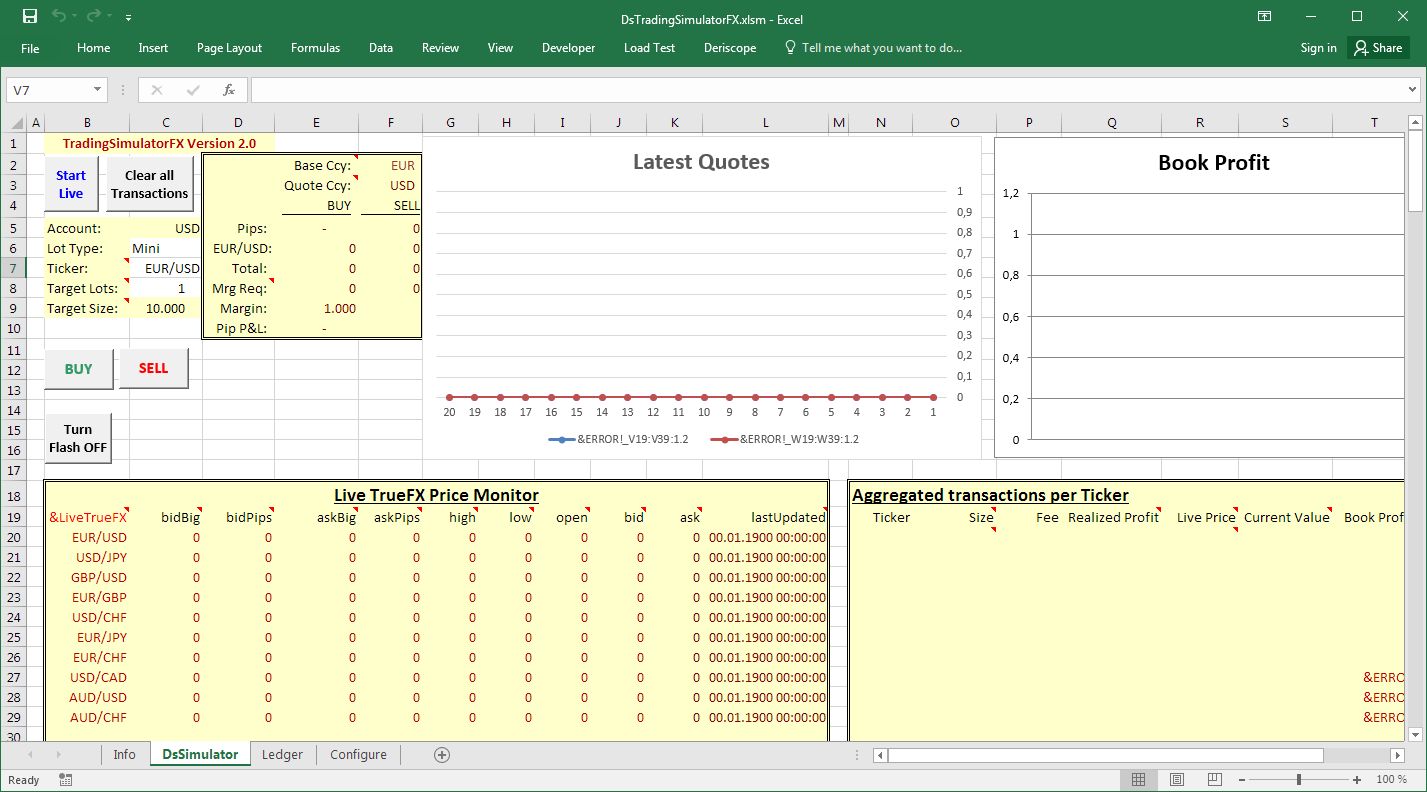
If your Excel is in automatic calculation mode, it is likely that errors will appear on the various cells due to Deriscope not being yet enabled.
Deriscope will be enabled and live feeds will keep coming as soon as you click on the "Start Live" button. You can control the frequency of the incoming live feeds at the sheet named "Configure" under the "Takt" label.
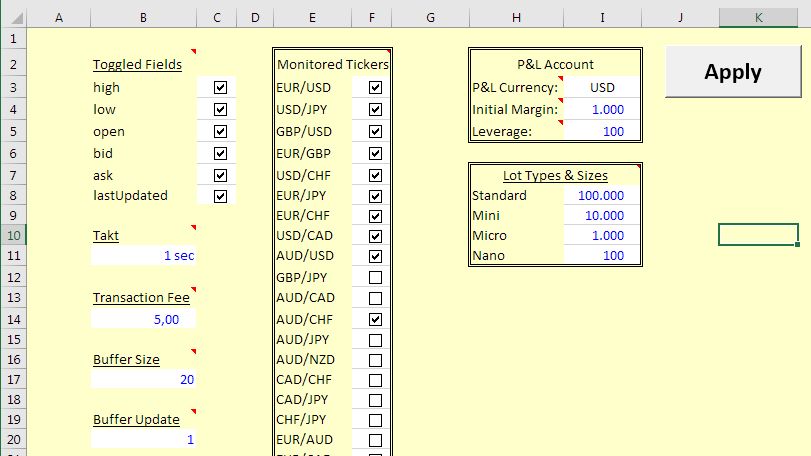
The default is set to 5 seconds, but you can set it as fast as 1 second.
In that "Configure" sheet you can also define the currency pairs you wish to monitor, the denomination currency of your brokerage account, the size of each trading lot, the leverage you agree with your broker and your initial investment amount. All these entries are fully explained in the respective cell comments.
The important aspect here is that live feeds are NOT time delayed! They are coming straight from TrueFX and provide you with the actual bid/offer quotes of the selected currency pairs. In particular the yellow area under "Live TrueFX Price Monitor" reports the current bid and offer rate on each currency pair listed on the left column. In addition, the high, low and open quotes are also reported plus the timestamp of the live feeds generation on the TrueFX server side. The next screenshot shows how the spreadsheet looks like during typical operation:
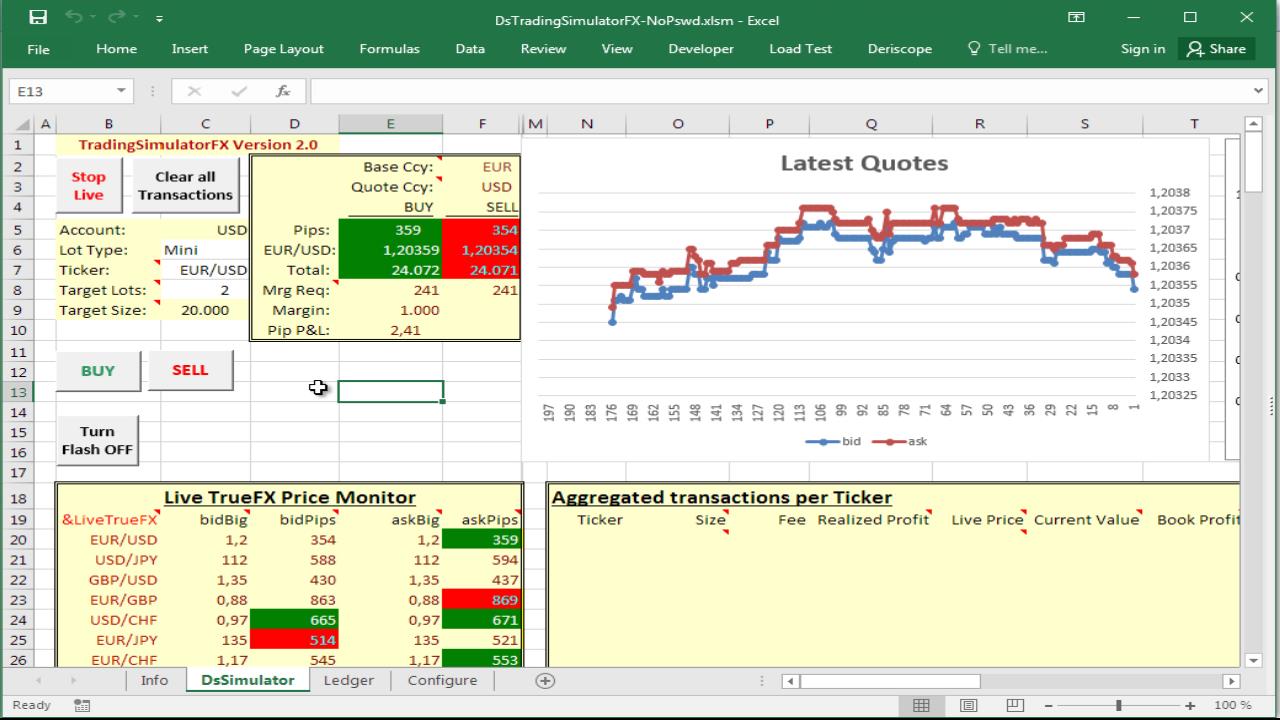
Just like the Stock Trading Simulator, this simulator also includes a chart of the bid and ask quotes that extend up to the time of the last received feed (see below).
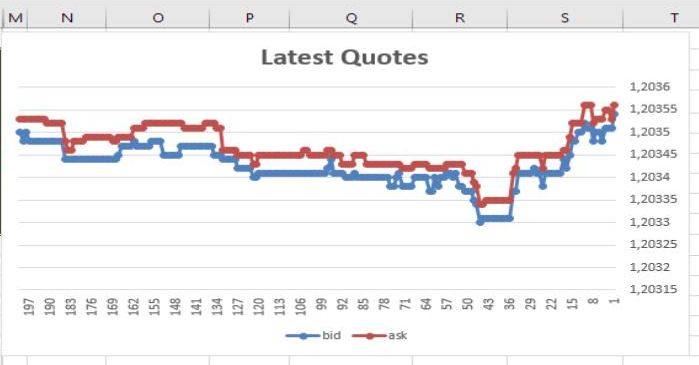
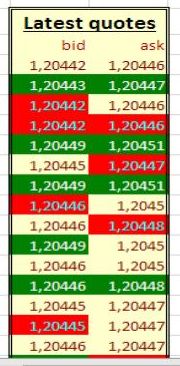
As in the Stock Trading Simulator, you can customize the total number of received feeds collected and retained in memory as well as the collection frequency (which may differ from the live feeds update frequency) in the "Configure" sheet. The quotes are then "poured", as soon as they are received, in the yellow area under the "Latest quotes" label as shown below.
Please read my comments on my previous post with regard to the possible uses from your part of these streaming data.
You are not restricted on placing orders on one currency pair only. You may select any pair out of those displayed in the Live Monitor area, provided its Quote Currency agrees with the Account Currency you have set in the "Configure" sheet. Then you may select the number of lots that you wish to trade and then press either the BUY or SELL button. Afterwards the details of the undertaken transaction are permanently recorded in the "Ledger" sheet (picture below).

As you keep placing BUY and SELL orders on various currency pairs, the Ledger keeps expanding, but you can conveniently see you aggregate positions on each pair as well as your total P&L at the table under the "Aggregated transactions per Ticker" label. Both the realized and total (book) P&L is reported. The respective chart titled "Book Profit" is a visual report on your current P&L position (picture below).
![]()
Below is a video tutorial that shows in more detail how you can use this spreadsheet.
Deriscope Forex Trading Simulator
Feel free to contact me if you want to share any thoughts with me with regard to this product or if you want me to add any particular features. Contact info and social media links are available at my web site https://www.deriscope.com
FinViz - an advanced stock screener (both for technical and fundamental traders)