Two months ago we suggested you to buy a list of stocks, carefully selected from SP500 index on both fundamental and technical criteria. One month later we have published the results: though our stocklist has clearly beaten SPY there were no evidences of formal statistical significance. Now there are. Moreover, you have an opportunity to buy our next stockpicking report just for $10.
In our previous ex-post analysis, published one month ago, we have shown that our stock list would have brought you 3% return, whereas SPY stagnated around the zero. However, neither the t-test nor Kolmogorov-Smirnov test have shown the statistical significance of our approach, meaning that the result might have been accidental. Now we can prove such significance.
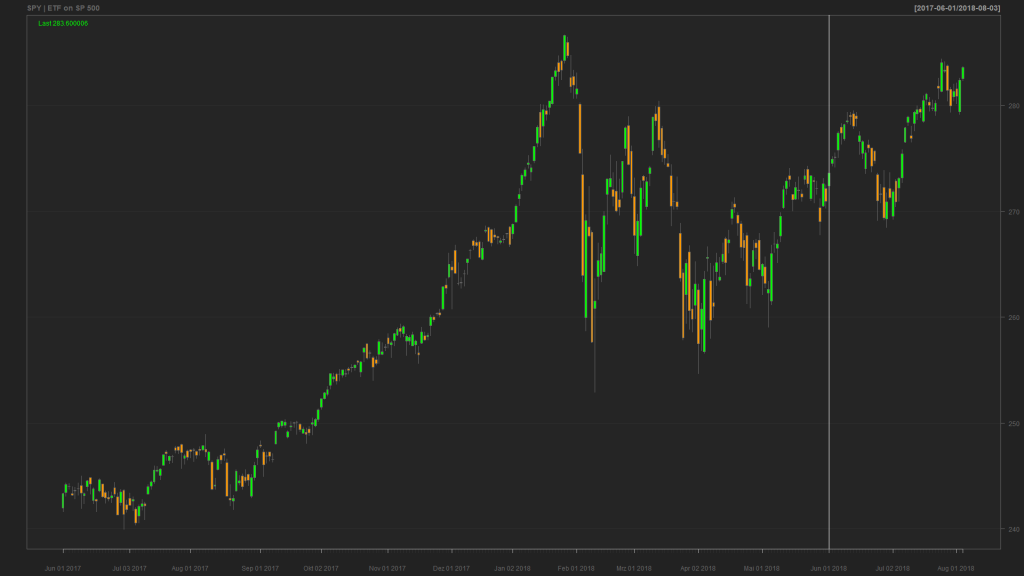
Both SPY and a portfolio of equally weighted SP500 stocks would bring about 3% during the last two months, whereas our portfolio would bring 5.5%.
| Stock | Price 03.08.2018 | P/L Since 01.06.2016 |
| VIACOM B | 28,93 | 7,5% |
| BIOGEN INC. | 342,499 | 15,2% |
| ACUITY BRANDS INC. | 135,349 | 13,8% |
| ADVANCE AUTO PARTS | 143,808 | 12,1% |
| ALPHABET INC A | 1232,155 | 8,7% |
| REGENERON PHARMACEUTICALS | 392,364 | 27,1% |
| APACHE CORP | 44,891 | 15,0% |
| GILEAD SCIENCES DL-,001 | 77,553 | 13,6% |
| MACYS | 38,724 | 9,0% |
| PROCTER GAMBLE | 81,984 | 11,3% |
| KIMCO REALTY CORP | 16,981 | 9,7% |
| BEST BUY CO INC | 75,647 | 9,5% |
| DISNEY (WALT) CO. | 113,379 | 14,1% |
| ALLIANCE DATA SYSTEMS | 226,235 | 7,1% |
| BRISTOL MEYERS | 58,761 | 10,7% |
| WELLS FARGO | 58,527 | 7,1% |
| ALEXION PHARMAC. | 123,442 | 4,0% |
| PPG INDUSTRIES | 110,298 | 7,5% |
| MOLSON COORS BREWING COMPANY | 68,823 | 11,0% |
| CENTURYLINK | 18,732 | 5,2% |
| PG&E | 42,701 | 0,8% |
| THE SOUTHERN COMPANY | 48,454 | 9,2% |
| WALGREENS BOOTS ALLIANCE CORP. | 66,49 | 5,2% |
| CBS CORP. | 53,131 | 4,1% |
| ALASKA AIR | 62,431 | 2,4% |
| AT&T INC. | 32,104 | -1,5% |
| INVESCO MORTGAGE CAPITAL | 16,284 | -0,5% |
| CINCINNATI FIN. | 75,083 | 6,5% |
| PHILIP MORRIS | 86,384 | 9,8% |
| APPLE COMPUTER INC. | 206,901 | 8,9% |
| MATTEL | 15,891 | 1,0% |
| GENERAL MILLS | 46,949 | 9,7% |
| CINTAS | 205,761 | 11,5% |
| INTL BUS. MACH. DL-,20 | 146,953 | 3,4% |
| CIMAREX | 93,514 | 5,8% |
| GOLDMAN SACHS BDC INC. | 21,75 | 5,4% |
| INTERCONT. EXCHANGE | 72,304 | 0,1% |
| COLGATE PALMOLIV | 67,124 | 6,6% |
| NASDAQ INC. | 91,11 | -1,3% |
| GGP INC. | 21,321 | 4,3% |
| VENTAS | 57,637 | 5,0% |
| SNAP INC | 12,676 | 10,1% |
| DUKE ENERGY CORP. (NEW) | 80,904 | 6,0% |
| FRANKLIN RESOURCES | 32,073 | -6,0% |
| PPL | 28,821 | 6,6% |
| CARDINAL HEALTH | 49,966 | -5,3% |
| APPLIED MATERIALS INC. | 48,568 | -6,9% |
| AMERICAN AIRLINES | 38,257 | -12,4% |
| XEROX CORP. REGISTERED SHARES DL 1 | 25,903 | -5,0% |
| INTEL CORP. DL-,001 | 49,339 | -13,2% |
| WHIRLPOOL CORP | 134,035 | -7,3% |
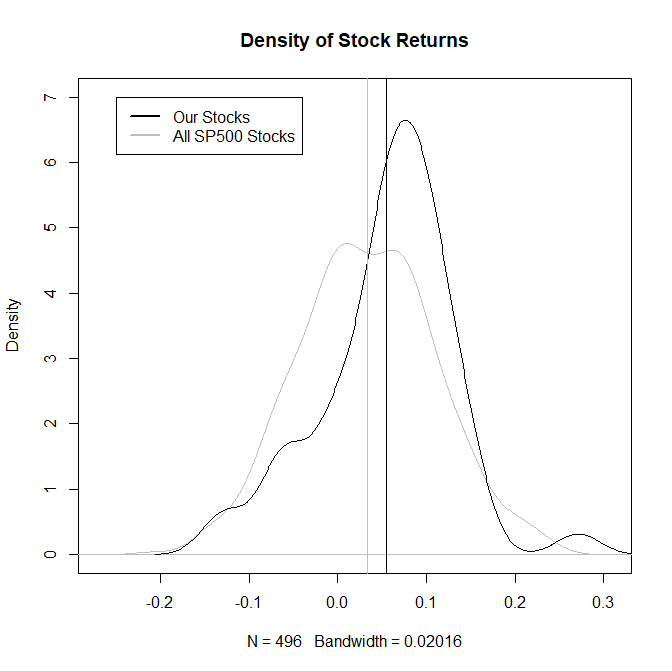
Again we compare the the density of stock returns from our list with the density of returns of all SP500 stocks (5 outliers were removed from both sides).

Further we run KS-test and t-test and obtain in both cases the 95% significance (by KS-Test even the 99% significance but one must be careful because the tested samples are not disjoint).
ks.test(x$rets, sort(juneRets)[5:500])
Two-sample Kolmogorov-Smirnov test
data: x$rets and sort(juneRets)[5:500]
D = 0.24016, p-value = 0.009646
alternative hypothesis: two-sided
Warnmeldung:
In ks.test(x$rets, sort(juneRets)[5:500]) :
im Falle von Bindungen sind die p-Werte approximativ
t.test(x$rets, sort(juneRets)[5:500])
Welch Two Sample t-test
data: x$rets and sort(juneRets)[5:500]
t = 2.0184, df = 61.769, p-value = 0.0479
alternative hypothesis: true difference in means is not equal to 0
95 percent confidence interval:
0.0002113524 0.0440392532
sample estimates:
mean of x mean of y
0.05533333 0.03320803
So you have seen that the outperformance was not an accident! Does it guarantee that our stock picking method will outperform the SPY in future? Of course not! However, it likely will, since we carefully select value-stocks with low P/E coefficients but high profits and we pay attention to trends and support/resistance level. Last but not least we prefer the stocks with low volatilities and correlations. All these factor should have provide a little bit of excess return. You are highly encouraged to check by means of our simulator what "a little bit" higher return (and lower volatility) means over the long term.
E.g. check 6% return and 20% vs. 7% return and 15% volatility over 10 years.
Are you convinced now? Then buy our next report for just $10 (Add to basket -> View basket -> CheckOut with PayPal).
And if still not convinced, have a look at the gallery of stock charts from our previous list.

FinViz - an advanced stock screener (both for technical and fundamental traders)


