Whereas the opinions on the usefulness of technical analysis are highly controversial, it is generally agreed that the fundamental analysis does make sense. Value investing, e.g. the choice of companies with low p/e and p/b coefficients but high RoE and EBIT-Margin is not an uncommon approach. However, the data quality and creative data interpretation are critical. Otherwise one yields yet another GiGo: Garbage in, Garbage out!
We, the team of letYourMoneyGrow.com regularly screen the market in search for good stocks. We rely both on chart and fundamental analysis. Whereas the former can hardly be formalized (we heavily engage the deep neural networks, both artificial and natural in our brains), we make no secret of which fundamental parameters we take into consideration. These are: P/E coefficient (both trailing and forward), P/B and Debt/Equity ratios, Return on Equities (RoE), gross, operative and profit margins.
And it does work (at least so far).
For American stocks we get data mostly from FinViz and Yahoo.Finance.
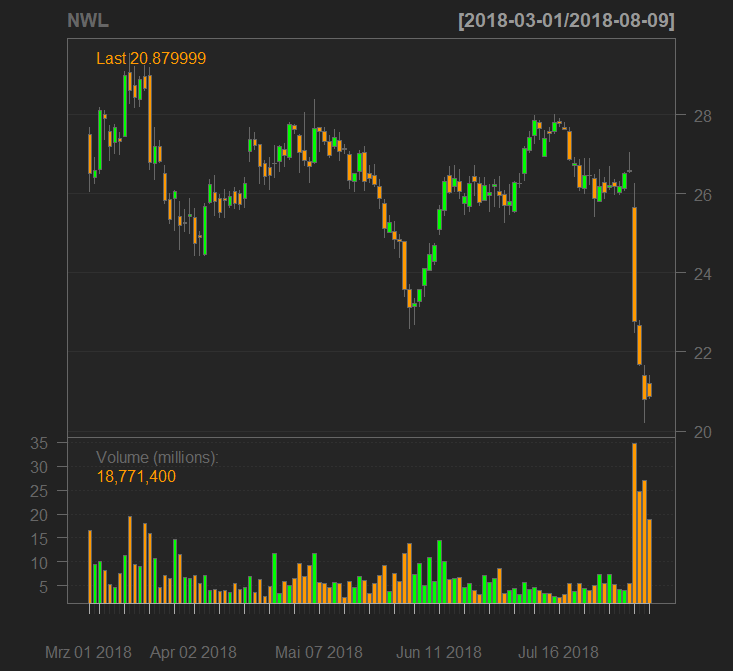
Practice shows that one needs at least two (more or less) independent data sources in order to avoid GiGo. Let us consider the case of NWL (Newell Brands Inc.), a stock from our 2nd stock pricking report.
We put is stock in our list on August 04, 2018 (Sat), however, it has significantly dropped on the next trading day August 06, 2018 (Mon).
 |
 |
Although the stocks from our stock picking reports, may, in principle be bought at once (on the date of report publishing or a bit later), we do not recommend such approach. We also do not sell our list as a kind of super-value-portfolio or something like this. We interpret it "merely" as a careful and complex screening results, which spare you the hours of staring on the display of your computer.
But one shall consider our results critically and if something like the recent drop of NWL happens, then patiently wait at least before the stock turbulence calms down and then check once again, whether the fundamentals are still attractive.
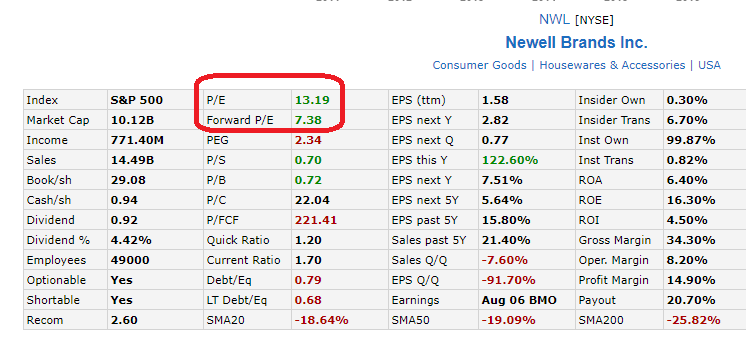
So we patiently weighted until the stock price ceased falling (at least for a while) and re-checked whether the fundamentals are still attractive. Because the stock is (currently) very volatile, we checked twice ... and found some big differences between FinViz and Yahoo.Finance!
| NWL Data: differences between Finviz and Yahoo.Finance | ||
| FinViz | Yahoo | |
| Trailing P/E | 13.19 | 4.90 |
| Forward P/E | 7.38 | 9.05 |
| Price/Book | 0.72 | 0.73 |
| RoE | 16.30% | 2.43% |
| EBIT-Margin | 8.20% | 9.11% |
 |
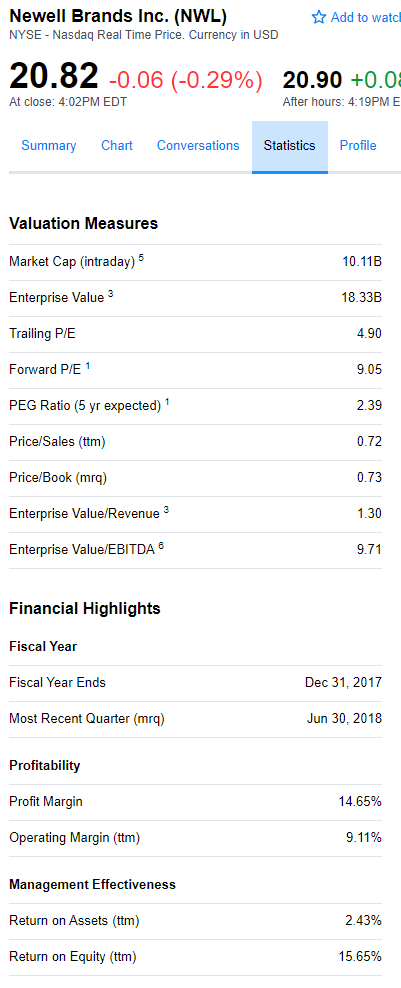 |
Whereas the numbers on P/B Ratio and EBIT-Margin generally agree, there are big differences between P/E coefficients and RoE. Well, to find which numbers are correct you may have a look directly at Investor Relation on NWL's website. However, it is not really necessarily since you may decide much quicker:
1. It does not matter whether the "genuine" P/E is 13.19, 7.38, 4.90 or 9,05. Important is that it is pretty low (both in terms of the industry sector and the whole market).
2. Bei EBIT-Margin of 8%-9% the RoE of 16.30% is much more plausible than that of 2.43% 🙂
And last but not least: we bought the stock closer to market closing on August, 09 2018. Of course - in terms of a good money management - strictly limiting the stock weight in portfolio. Stay tuned and watch whether our analysis worked in this case 😉
FinViz - an advanced stock screener (both for technical and fundamental traders)