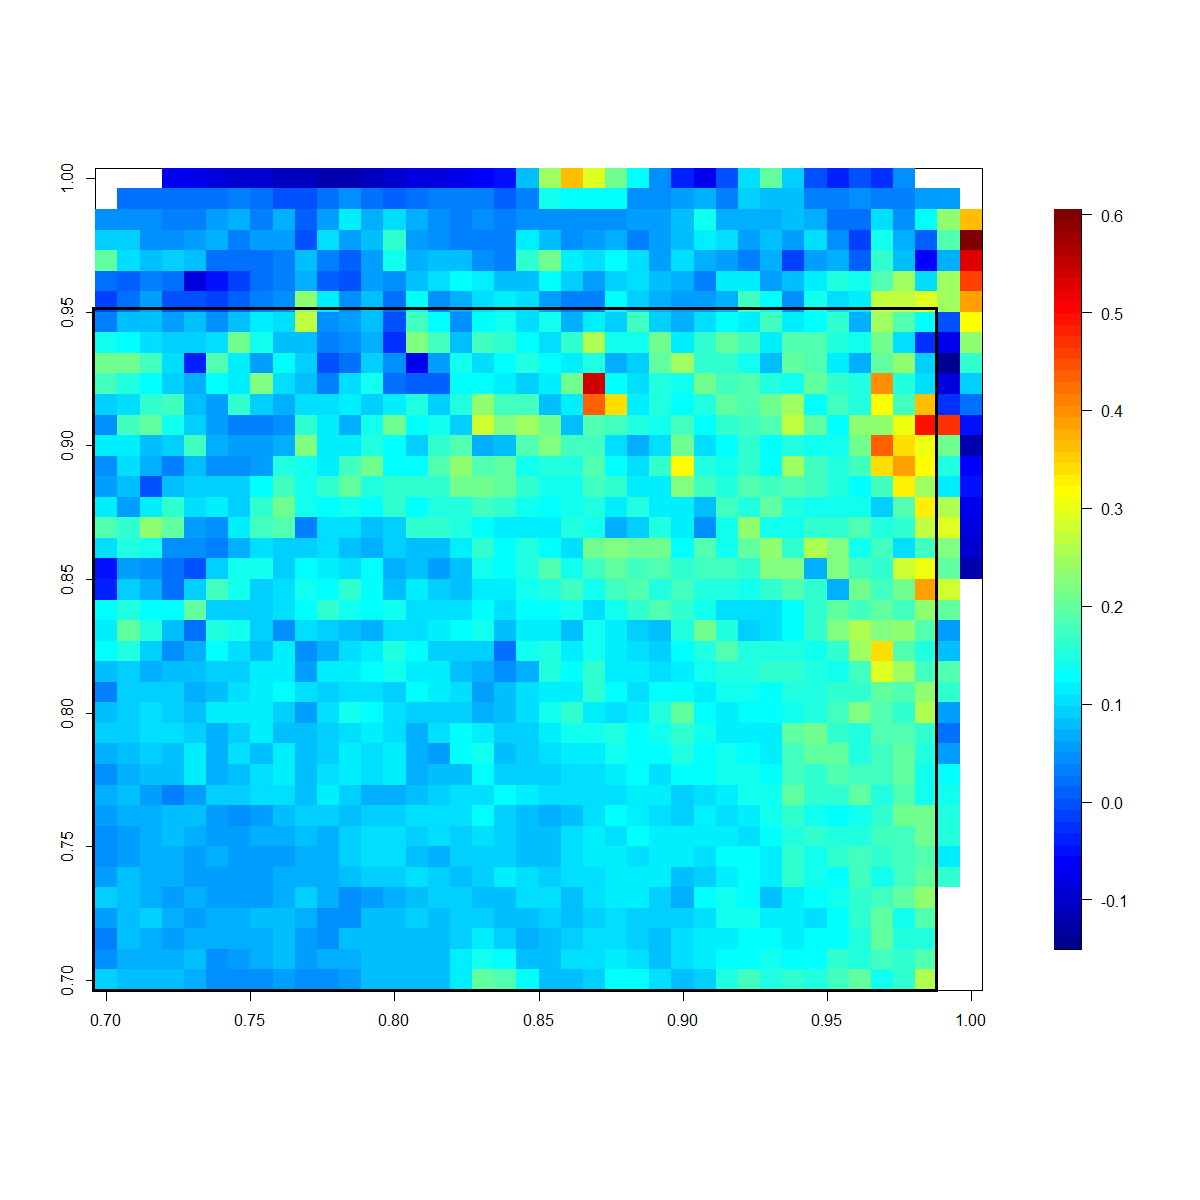
plotting a heatMap with R – package akima Home › Forums › Quantitative Methods and Programming › plotting a heatMap with R – package akima This topic has 0 replies, 1 voice, and was last updated 5 years, 2 months ago by letYourMoneyGrow.com. Viewing 1 post (of 1 total) Author Posts 4th May 2021 at 10:50 pm #21203 letYourMoneyGrow.comKeymaster library(akima) library(fields) mhu = aggregate(hu$ret, by=list(hu$sGrow1, hu$sGrow2), FUN=mean) names(mhu)=c("ret", "sGrow1", "sGrow2") s <- interp(mhu$ret,mhu$sGrow1,mhu$sGrow2) image.plot(s) Attachments:NN_heatMap_MeanReturn_RUSSELL1000.png Author Posts Viewing 1 post (of 1 total) You must be logged in to reply to this topic. Log In Username: Password: Keep me signed in Log In Share this: Share on LinkedIn (Opens in new window) LinkedIn Share on Facebook (Opens in new window) Facebook Share on X (Opens in new window) X Share on Telegram (Opens in new window) Telegram Share on Reddit (Opens in new window) Reddit Share on WhatsApp (Opens in new window) WhatsApp Print (Opens in new window) Print
.