Wikifolio is a FinTech start-up that lets virtually everybody to become an fund manager. Wikifolio adheres to highest public disclosure standards, in particular current portfolios and complete trading statistics are available in real time. However, wikifolio lacks any statistical and chart analysis. One cannot even add a benchmark like DAX or DJ30 to a wikifolio chart.
We propose a way to increase the value of disclosed information and looking forward for feedback from both Wikifolio trades and investors. We also hope for official feedback from Wikifolio team.
A couple of months ago I studied the case of Einstein and by means of statistical analysis proved that he has systematically (i.e. not just by good luck) beaten the market. Later I analyzed my own wikifolio "Somewhat better than DUCKS" and showed the non-randomness and sustainability of my performance. Moreover, I have demonstrated that my fund is also superior in terms of a saving plan (Sparplan), since I was better than DAX almost every month (and this is pretty important for many retail investors).
Of course no performance in the past guaranties the future performance. In particular, Einstein's wikifolio stagnated during last months (however, now it rockets again) and in December I was worse than DUCKS (however, I made +3.2% in December and in-all I still outperform the DAX).
Quantitative statistical analysis is in no way to understand as a silver bullet. Yet it may be very helpful: though the performance in the past does not guarantee the future performance, the lack (or randomness) of the past performance is a strong sign to avoid a fund. Additionally, an optimal choice of wikifolios is nothing else but a good old portfolio optimization problem. Having not only historical price data but also a complete trading history, one can diversify pretty efficiently, e.g. spreading his capital over wikifolios with difference focus point (both in the sense of assets and trading approaches). I, for one, would consider a combination of wikifolios that invest in American and German Stock, in Commodities and would strive an optimal balance between heavy traders and loyal investors (treu Anleger). Though wikifolio does try to meet this challenge and introduces numerous quality signs ("actively diversified", "good money manager", "continuous growth", etc) I would prefer to have a deeper and verifiable insight. Last but not least, I would like to estimate possible scenarios and risks for the wikifolios. This is a common practice for institutional asset manager and if Wikifolio catches up here, it will likely really disrupt the traditional actively managed funds (whose miserable performance we will review in near future).
One may object that a statistical analysis is too complicated for a typical private investor. Well, of course 95% of retail investors are unable to do this analysis but I would claim that most of them are able to understand its results. And it is the problem we address: Wikifolio provides a complete data set but it is useless for 95% of (potential) investors since they are not statisticians. Moreover, also not all Wikifolio traders are quants, however, they can readily profit from this analysis as well. For instance, Sascha Gebhard's wikifolio "DACH Trading and Invest" is one of the most successful.

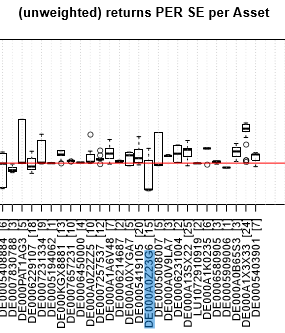
But probably Sascha might have been even better if regularly reviewed the "unsuccessful" stocks. The Boxplot of returns PER SE per Asset shows that e.g. DEAG Deutsche Entertainment AG (DE000A0Z23G6) brings rather a bad luck: Sascha committed 15 sell-transactions with it and almost all of them with loss. On the other hand he was very successful with CANCOM SE DE0005419105 (next box on the left-hand side from DEAG): he committed 20 sell-trades and most of them with profit. In description of his wikifolio Sascha states "First of all, matching equities are to be identified by means of fundamental analyses". So he may probably keep his approach to analysis of IT-branch (to which CANCOM SE belongs) but review his approach to Entertainment (the branch of DEAG).
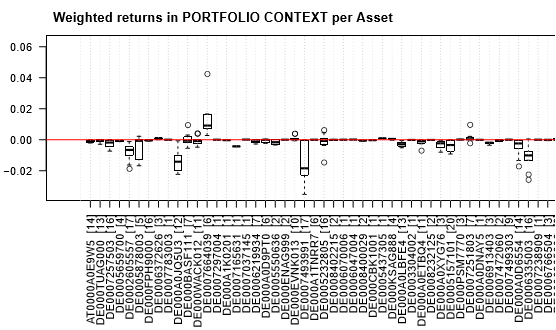
As to a potential investor, he would rather pay attention to the Boxplot of returns per asset in portfolio context. We mean, per se a trade can bring a big profit or loss (say, ±50%) but if the position weight in portfolio is small (say, 1%) then the effect in portfolio context is equal to 0.5 * 0.01 = 0.5% - and this is what finally matters for a investor: a profit (or loss) of 0.5% of the wealth.

First of all an investor readily sees that Sascha is deservedly distinguished as a good money manager: he successfully avoids big losses. Though we also see that he, in a sense, falls in love with stocks (boxes below the 0.0-line are associated with many trades, which means that Sascha tries to catch up with the same stocks) but as long as he remains a disciplined money manager it is not a problem.
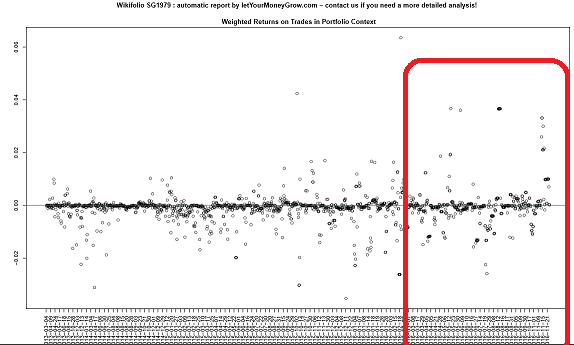
The chart of returns time series is also a good evidence that Sascha achieves his performance not by chance but by means of a consequent hard work.

We see that his return structure remains consistent and more or less homogeneous in time. The latter lets us assume that he will continue the similar way in future. Yes, we see that starting from 2015 the volatility of returns did increase. But this is because the market was particularly volatile (we cannot see it from the chart but we could have seen it if put the DAX returns as a benchmark).
As to the chart of unweighted returns, it just serves for better visibility. If positions are small, their small weights will dominate over their performance on the chart of weighted returns. So the chart of unweighted returns (per position per se) can be helpful. In order to speak for a good and sustainable performance, this chart should also be more or less homogeneous.
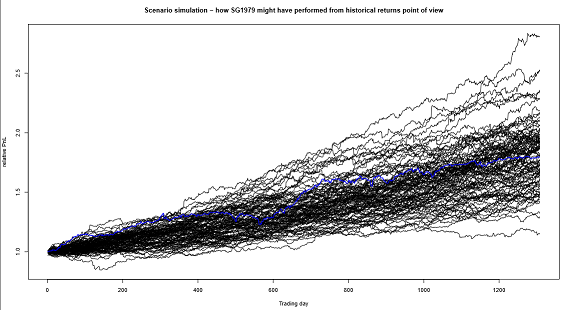
Finally, we know how DACH Trade and Investment performed. But every (potential) investor is interested in knowing how it might have performed because it also give a hint how it may perform in future. We took daily historical price data, which are also provided by Wikifolio, and simulated 100 portfolio paths by means of sampling with replacement. And there is one very important observation: although the portfolio (temporarily) might have gone in minus, in the mid term (1200 days ≈ 4 years) none of scenarios ended up with a loss! Thus Sascha fully deserves the "continuous growth" badge.

We did not limit ourselves only with Sascha's wikifolio, it is just one of seven (randomly chosen) good wikifolios, here they are:
- DMTRADES - Carpe diem Aktientrading - by carpediem7 (Dirk Middendorf)
- 23072013 - Deutscher Mittelstand - by hzenger (Hans Zenger)
- GOLDTDG - Goldesel Trading - by goldeseltrading (Michael Flender)
- CHANCEJO - Tradingchancen dt Nebenwerte - by joibaer (Joachim Koengeter)
- 20122012 - Dividende und Eigenkapital Deutschland - by Schneeleopard (Holger Degener)
- JO1962 - Tradingchancen deutsche Aktien - by joibaer (Joachim Köngeter)
- SG1979 - DACH Trading and Invest - by nickleeson79 (Sascha Gebhard)
All traders that are interested in been reviewed in the same way (and probably even more detailed) are encouraged to present their wikifolios and post a review-request in respective forum. We cannot promise to fulfill all requests but active forum participators, bloggers that link to letYourMoneyGrow.com and, last but not least, good performers have priority 🙂
We also hope that Wikifolio management will be interested in further collaboration. The statistics can evaluate though not everything but a lot! What we demonstrated is just a small part of iceberg. And one should not underestimated the ability of non-professional investors, by a proper explanation they will understand the evaluation results! Of course reading or listening to this explanation will take some time and efforts. But ohne Fleiß kein Preis (no sweet without sweat), as Germans say!
Roboadvisors might offer a seemingly easy solution but there is only one thing on the market that goes easily: losing the money! Just like everyone does his best to choose the best doctor, lawyer or car mechanic, one should do his best to choose the best investment opportunity and portfolio manager! Statistics and letYourMoneyGrow.com may help.
FinViz - an advanced stock screener (both for technical and fundamental traders)
