It is relatively easy to visualize the aggregated statistics over many periods, e.g. by means of the boxplot series. However, it may be challenging if you want to have a simultaneous look at every element for all time periods. We propose to do it by means of an animated 3D-scatterplot.
Previously we have shown how to visualize the market summary w.r.t. to the stock fundamental data. Such overview shall be sufficient for a macrotrader but is definitely insufficient for a stock picker, who needs to track the dynamics of single stocks, compared to each other.
Additionally, there is a problem of missing data. It is not especially acute for a macro-view on market (it is enough to have data on many but not necessarily on all stocks in order to grasp a measure of central tendency) but for a single stock it might be crucial.
But how to visualize the fundamental dynamics of several hundred stocks over 80 quarters?!
A naive way may be as follows:
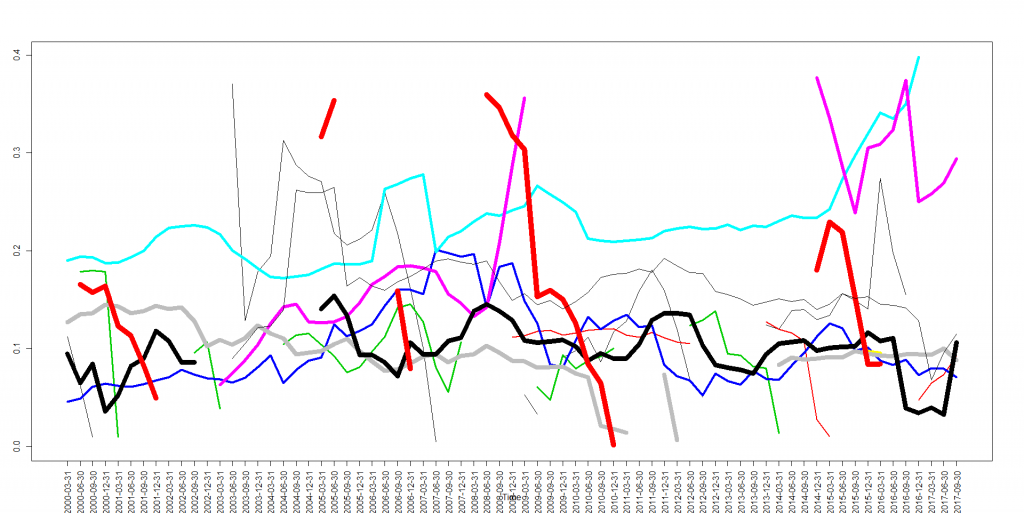
ts.plot(t(dataMatrix[10:20,]), col=seq(1:10), lwd=seq(1,10),  gpars=list(xaxt="n"))
axis(1, at=1:length(dtFrom), tick=1:length(dtFrom), labels=dtFrom, las=2)
#....etc

If the dataMatrix contains NA where the data are missing, ts.plot() will draw them correctly. Since it is very hard (at least for me) to grasp an intermittent chart, I additionally variate the line thicknesses. A more advanced approach might be to fill the gaps with thin dotted lines but in either case one can hardly put more than 10 graphs on a single chart.
Alternatively, one can make an animated chart as follows
library(scatterplot3d)
#xxx - X-coordinates (stock order number)
#yyy - Y-coordinates (quarters)
#zzz - considered fundamental value
s3d <- scatterplot3d(xxx,yyy,zzz)
for(pp in 1:N_STOCKS)
{
    idxI = intersect(which(xxx==pp), which(!is.na(zzz)))
    s3d$points(xxx[idxI],yyy[idxI],zzz[idxI], type="o", col="blue", lwd=2)
    Sys.sleep(0.5)
    s3d$points(xxx[idxI],yyy[idxI],zzz[idxI], type="o", col="green", lwd=2)
    s3d$points(xxx[idxI],yyy[idxI],zzz[idxI], type="o", col="black", lwd=1)
}
In this example we considered the equity-to-asset ratio (Eigenkapitalquote) and we see that it is pretty volatile from quarter to quarter... which means that the data from stockpup.com might be inconsistent, since this property is expected to be somewhat more stable.
FinViz - an advanced stock screener (both for technical and fundamental traders)
