We continue publishing the visualized results from Vasily Nekrasov's research. Reportedly, when Warren Buffett happens to hear complains that there are thousands of stocks to scrutinize, he says "well, start with letter A". We go even further and start with digit 0, since there are (were) suchlike tickers by yahoo.finance.
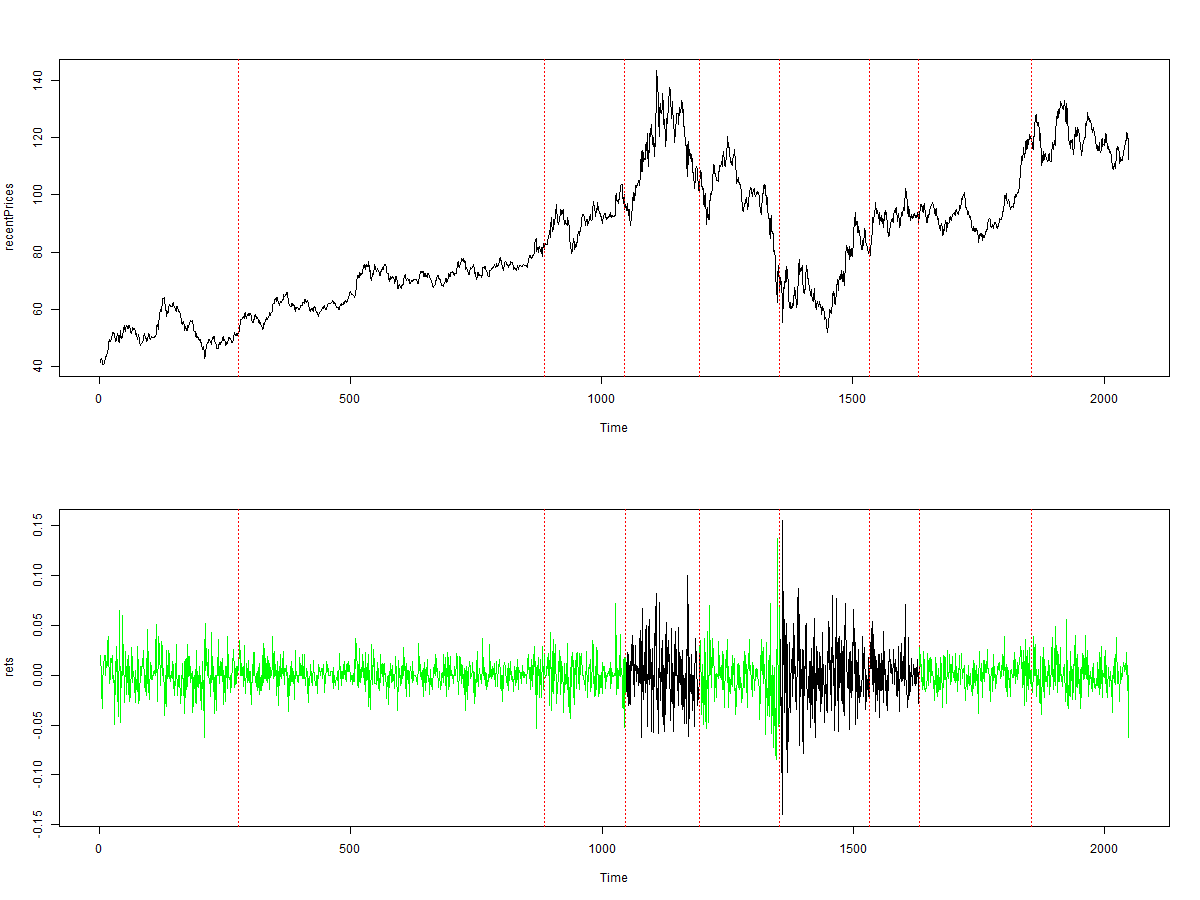
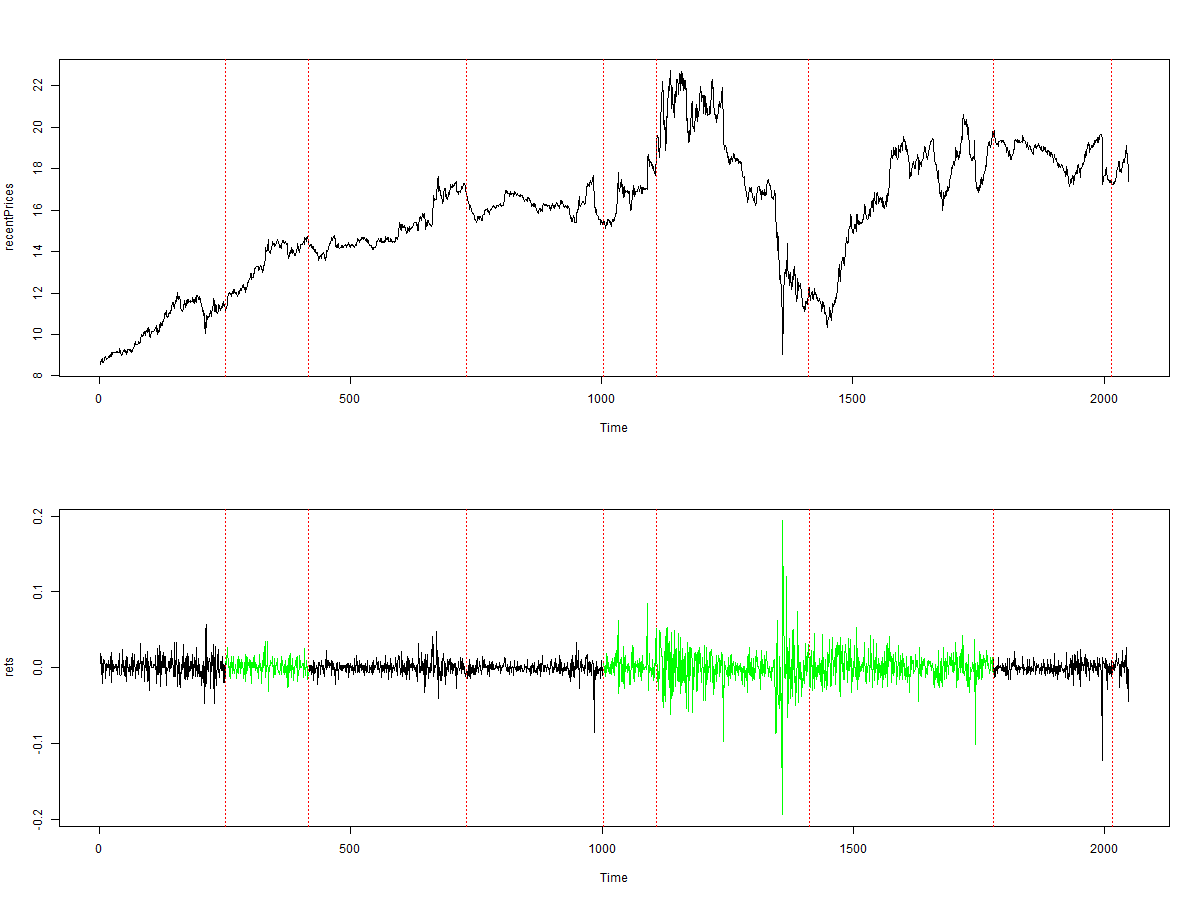
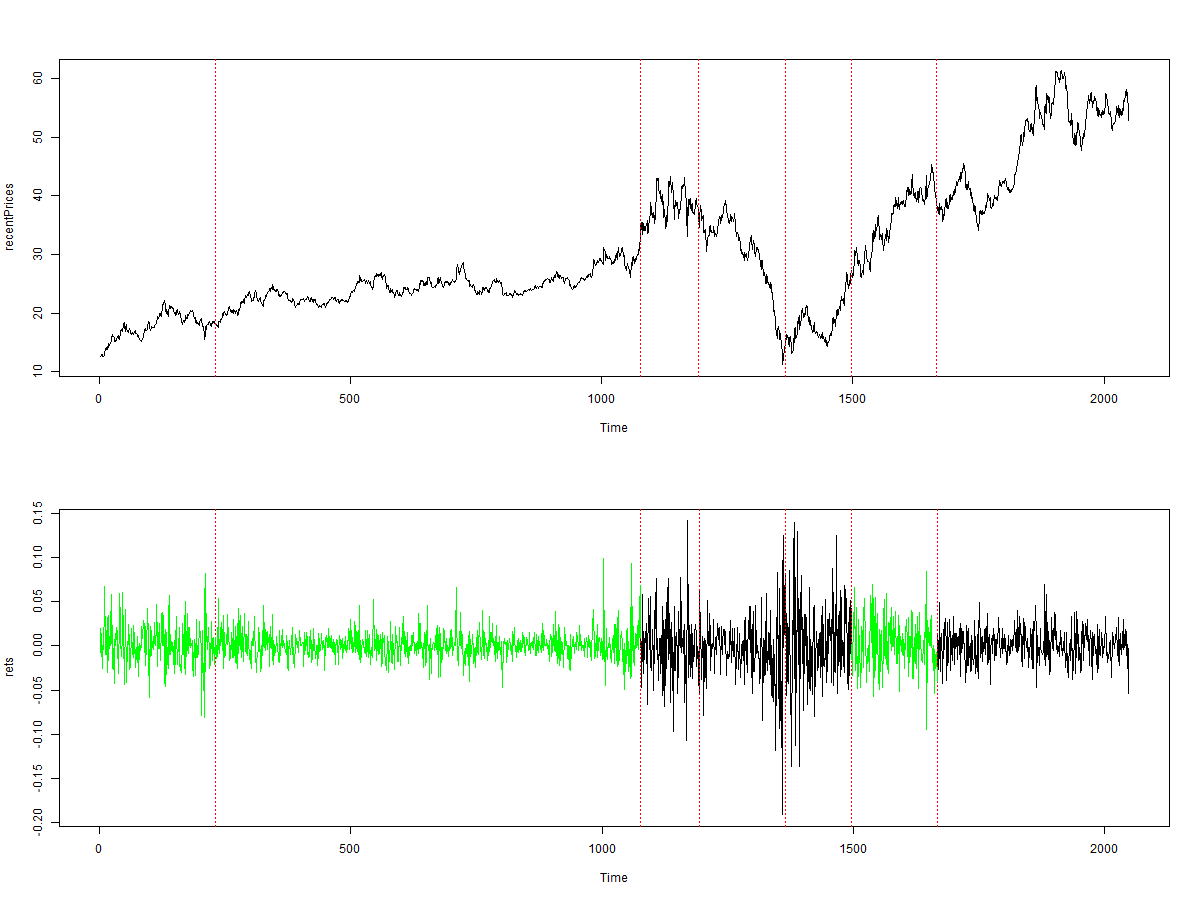
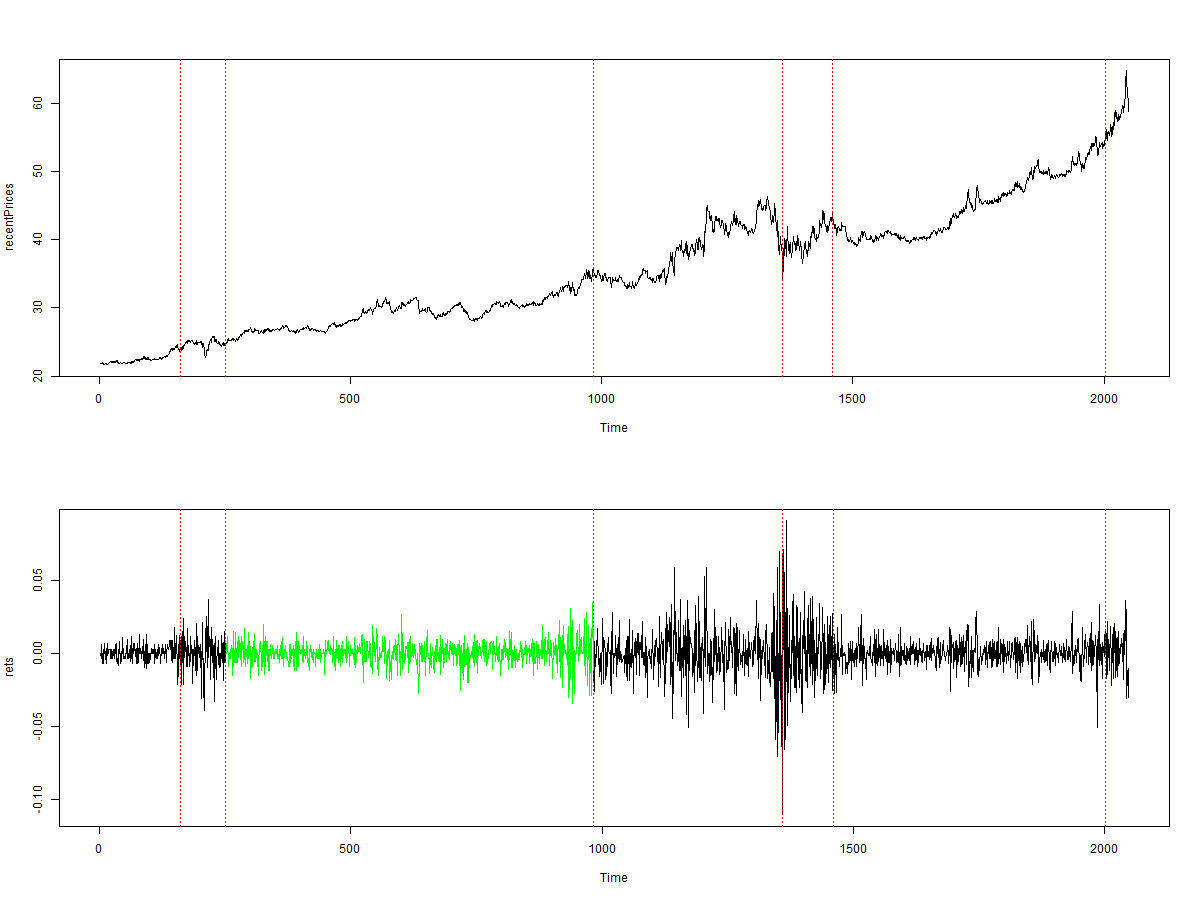
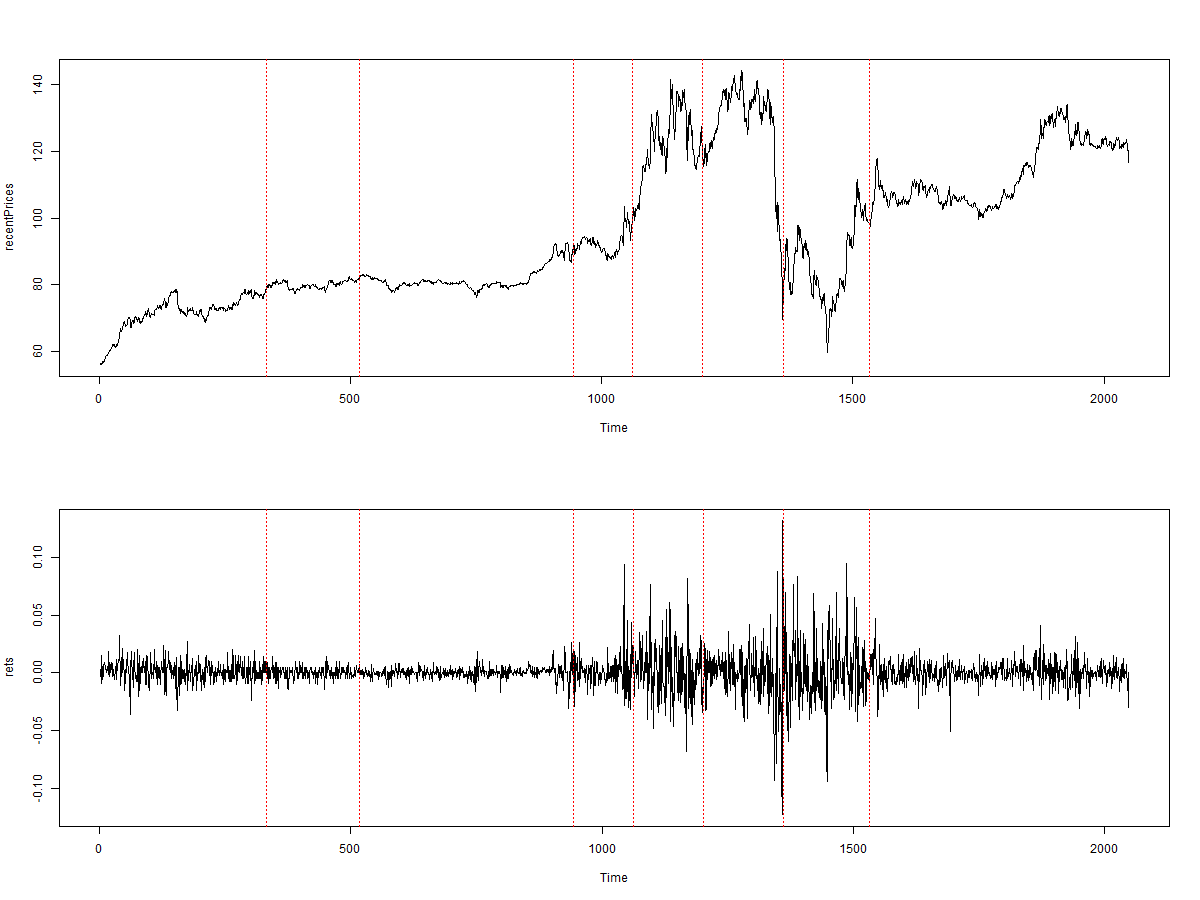
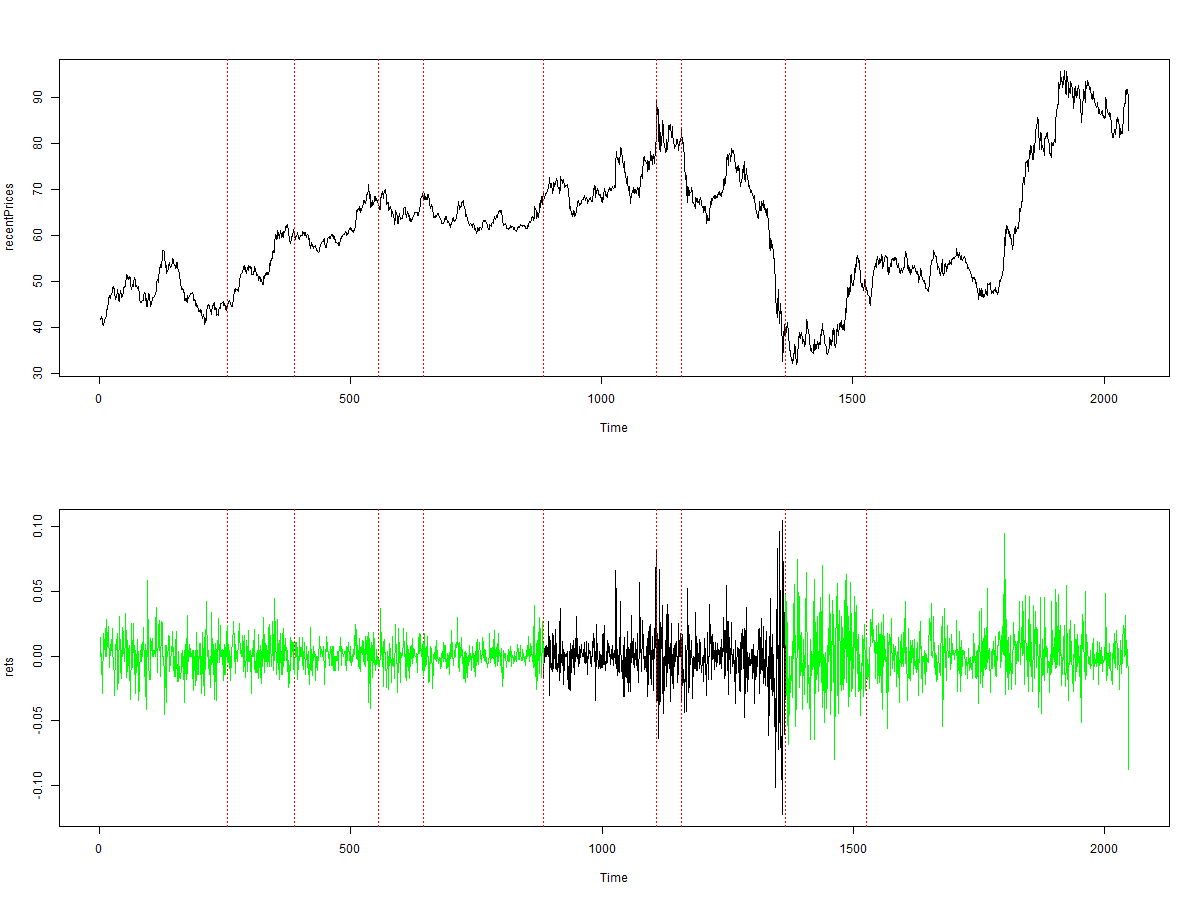
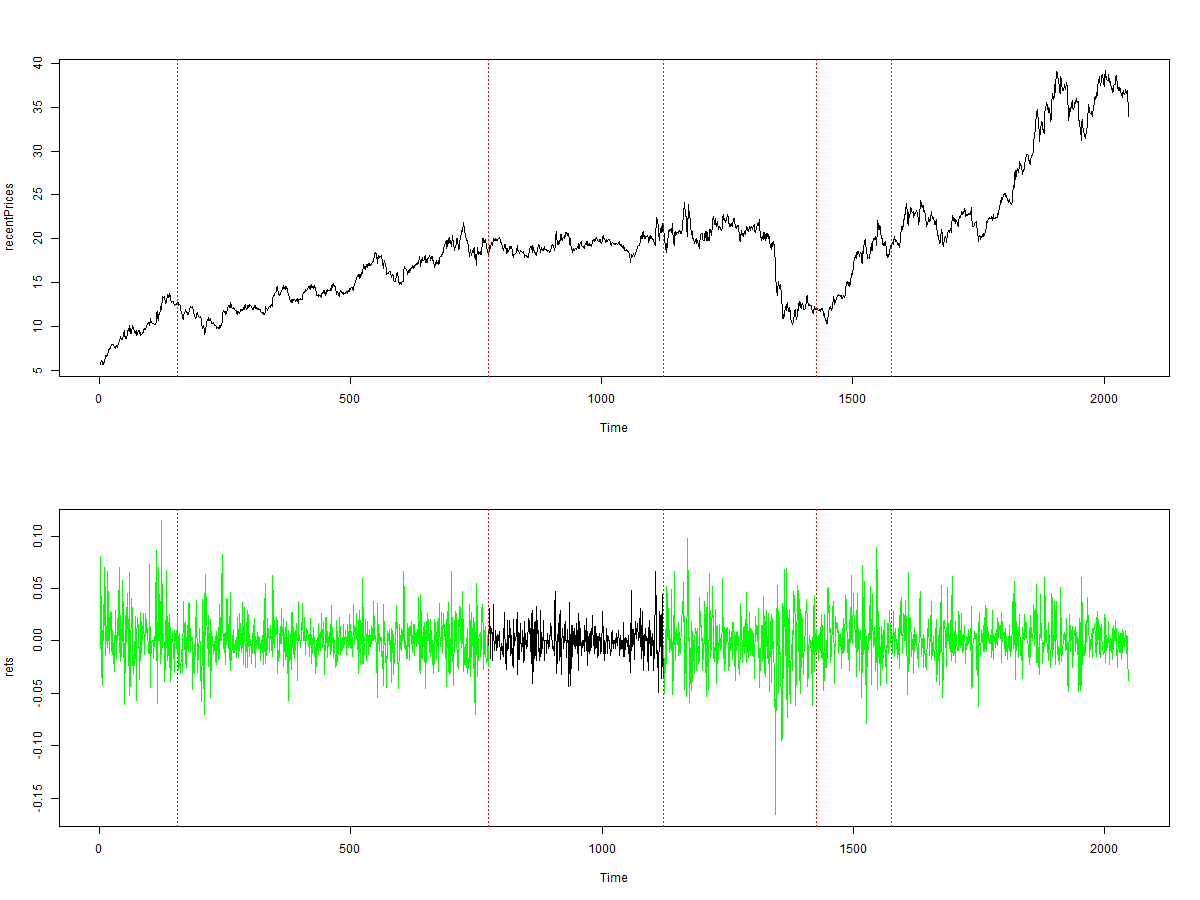
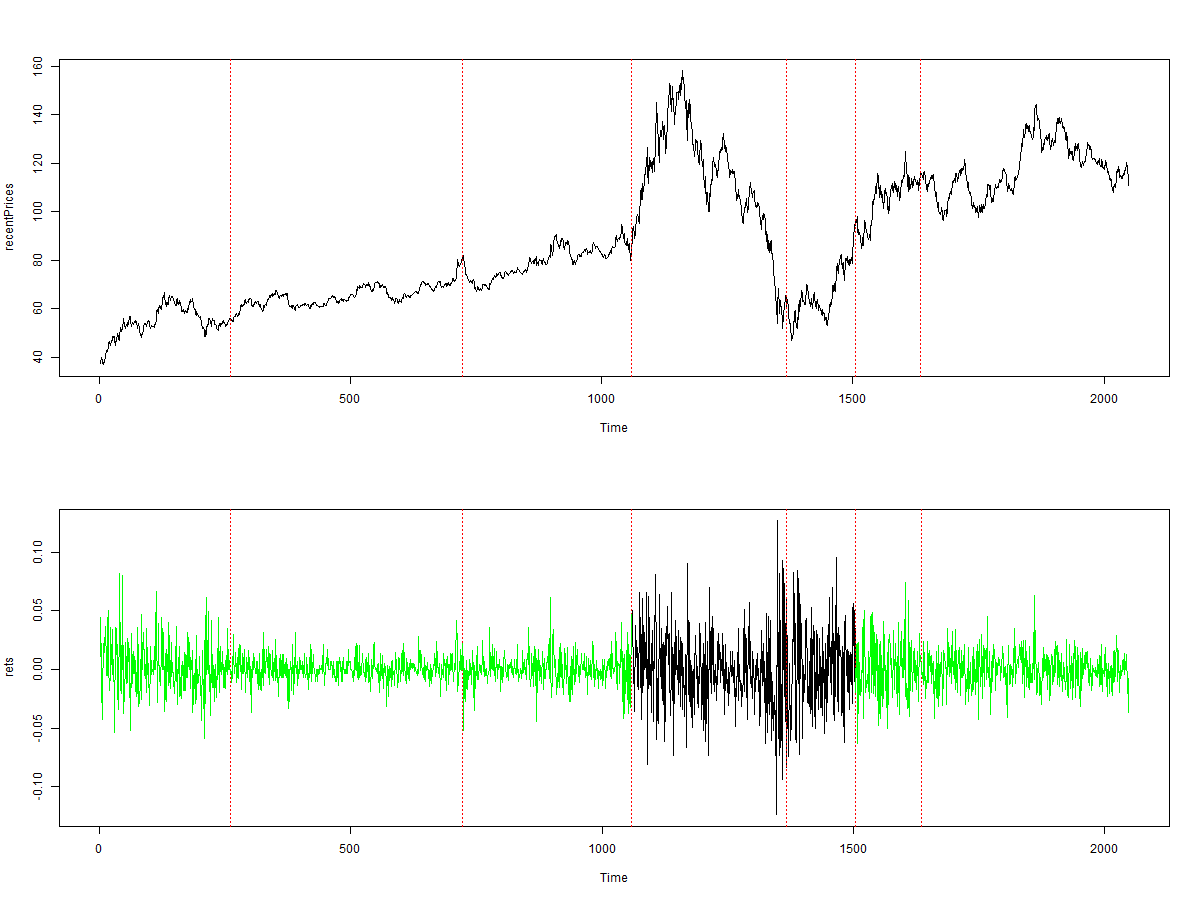
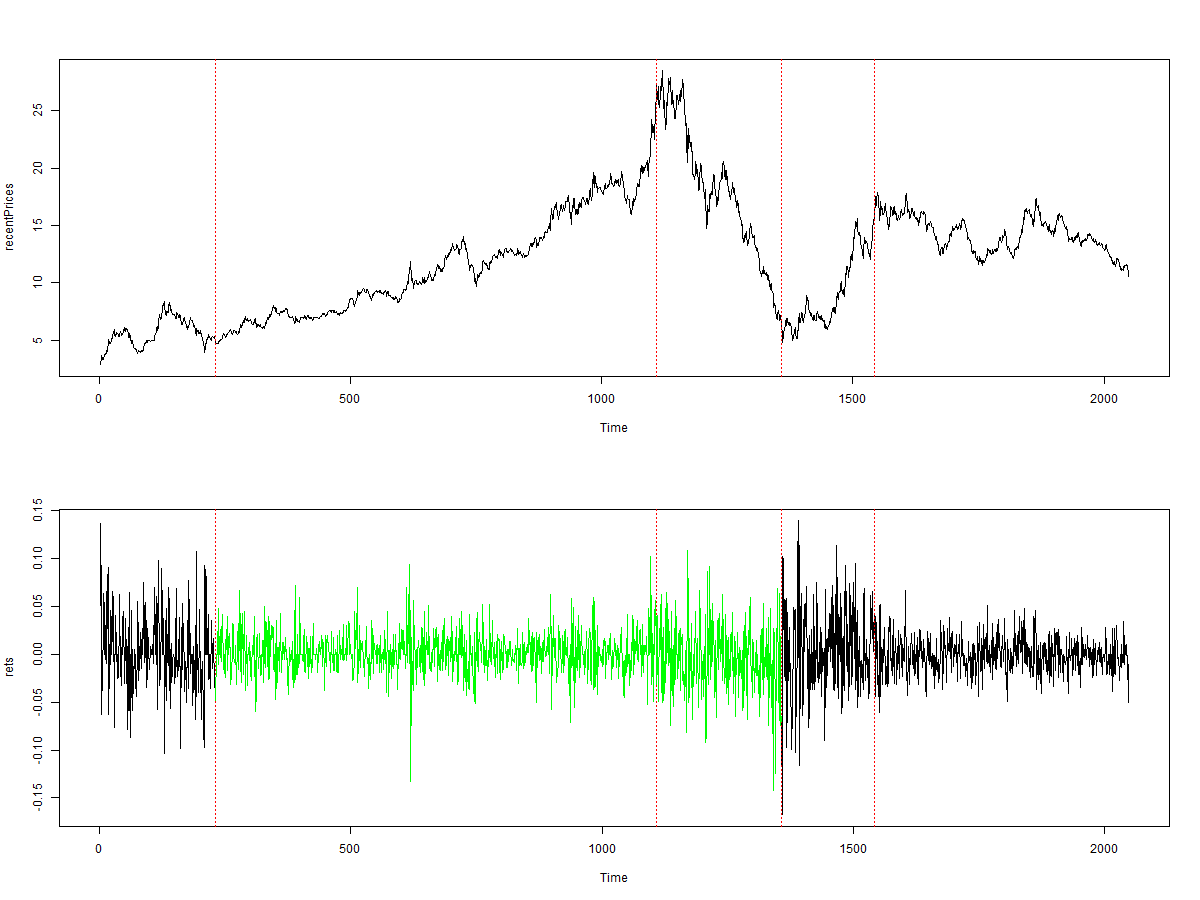
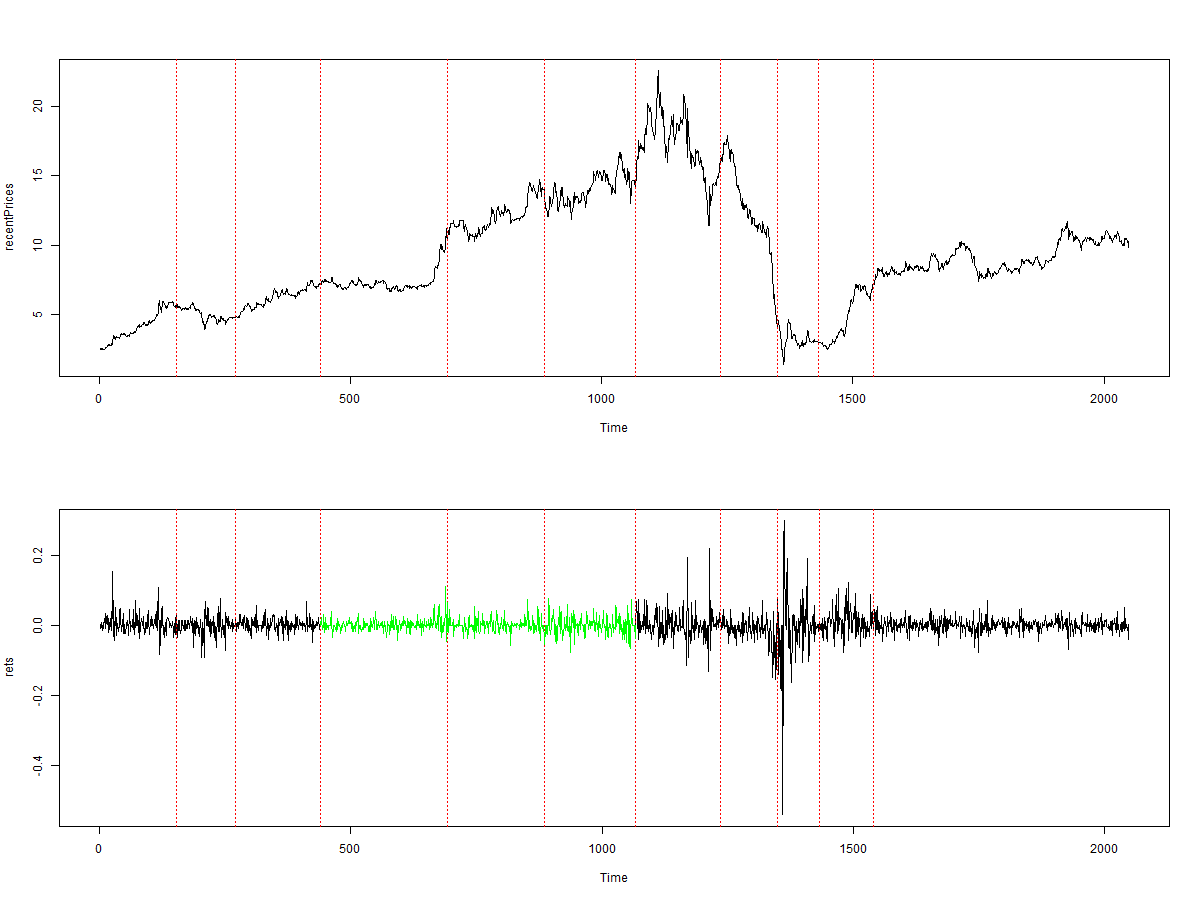
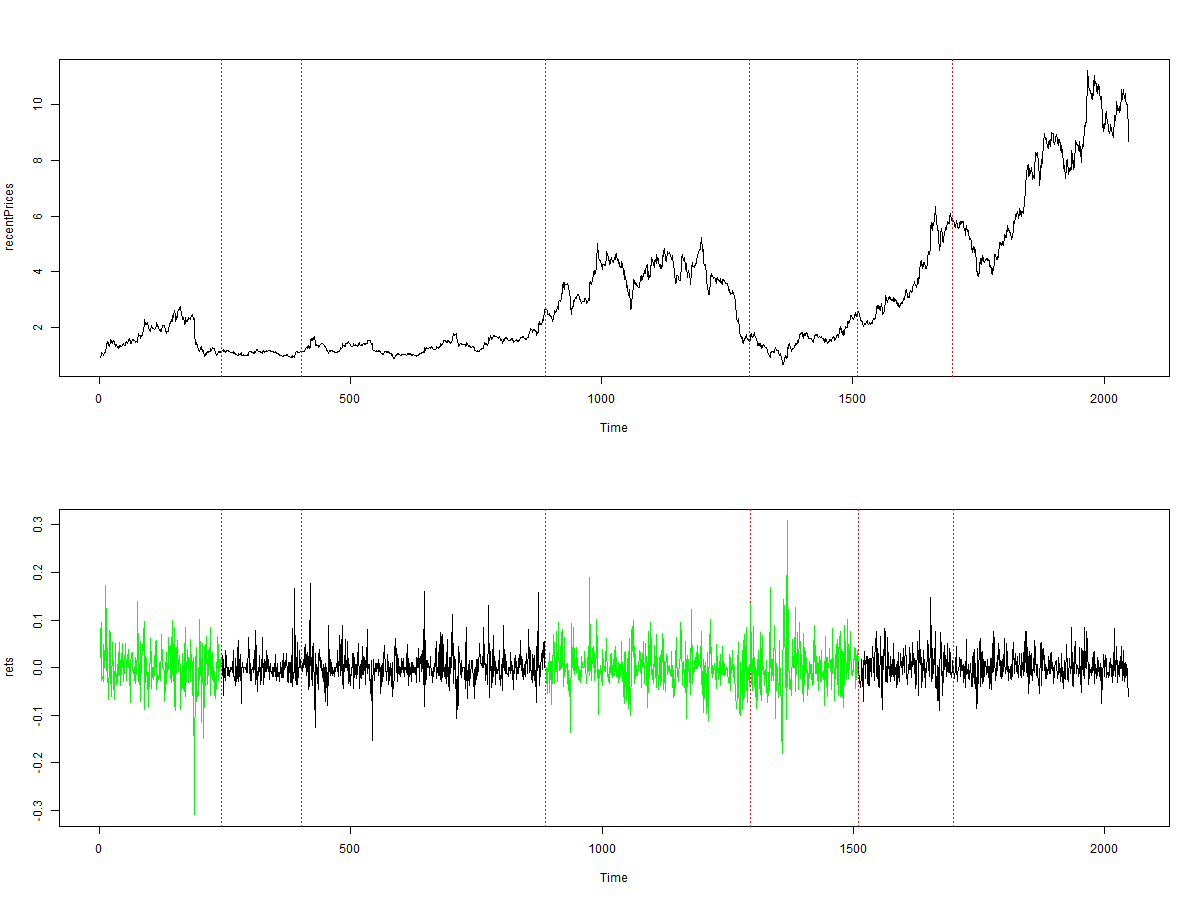
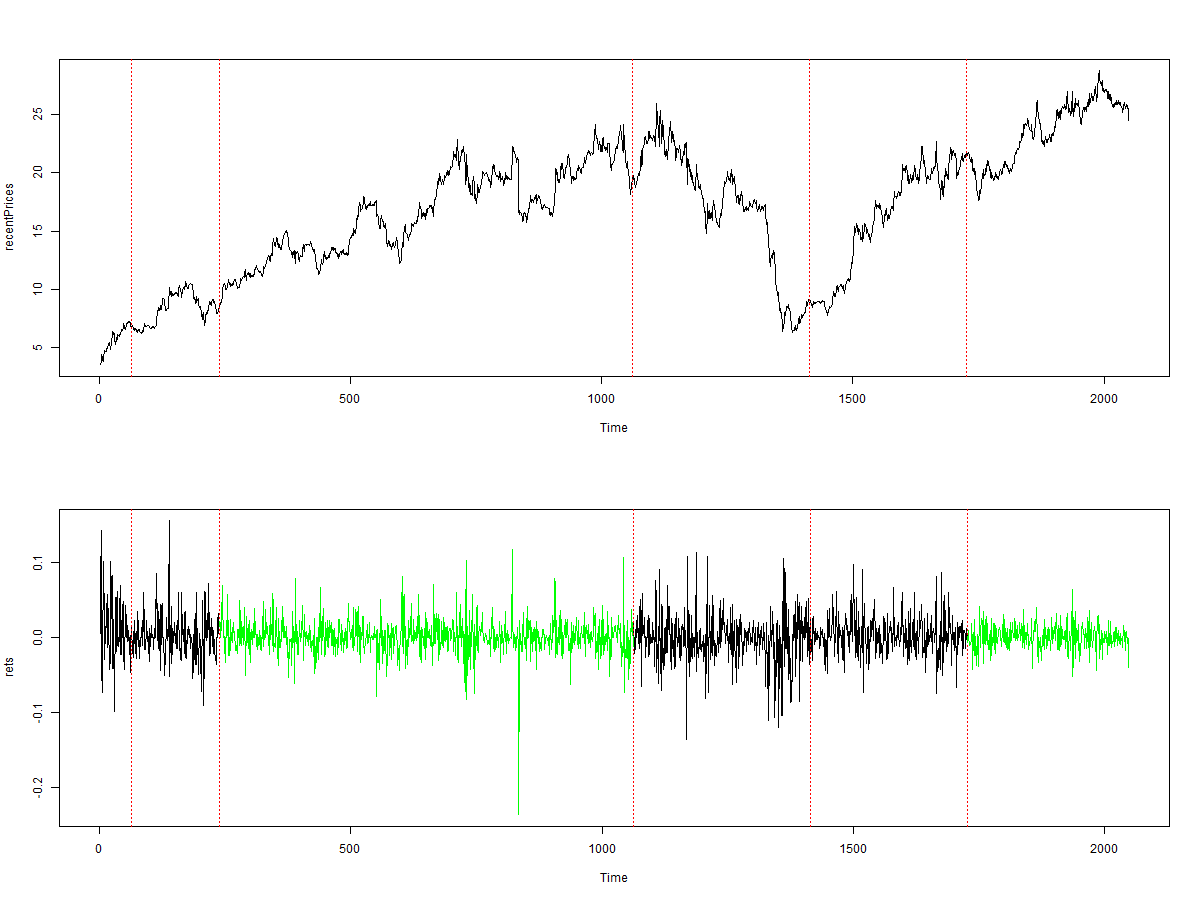
We deliberately did not filter the outliers/bad time series because it is a good exercise to recognizes them visually. And once again: the segments with piecewise-stationary volatility are marked in green. In happens that two adjacent segments are green. But of course it does not mean that we can infer the volatility parameters of the second segment from the first one.
0001.HK

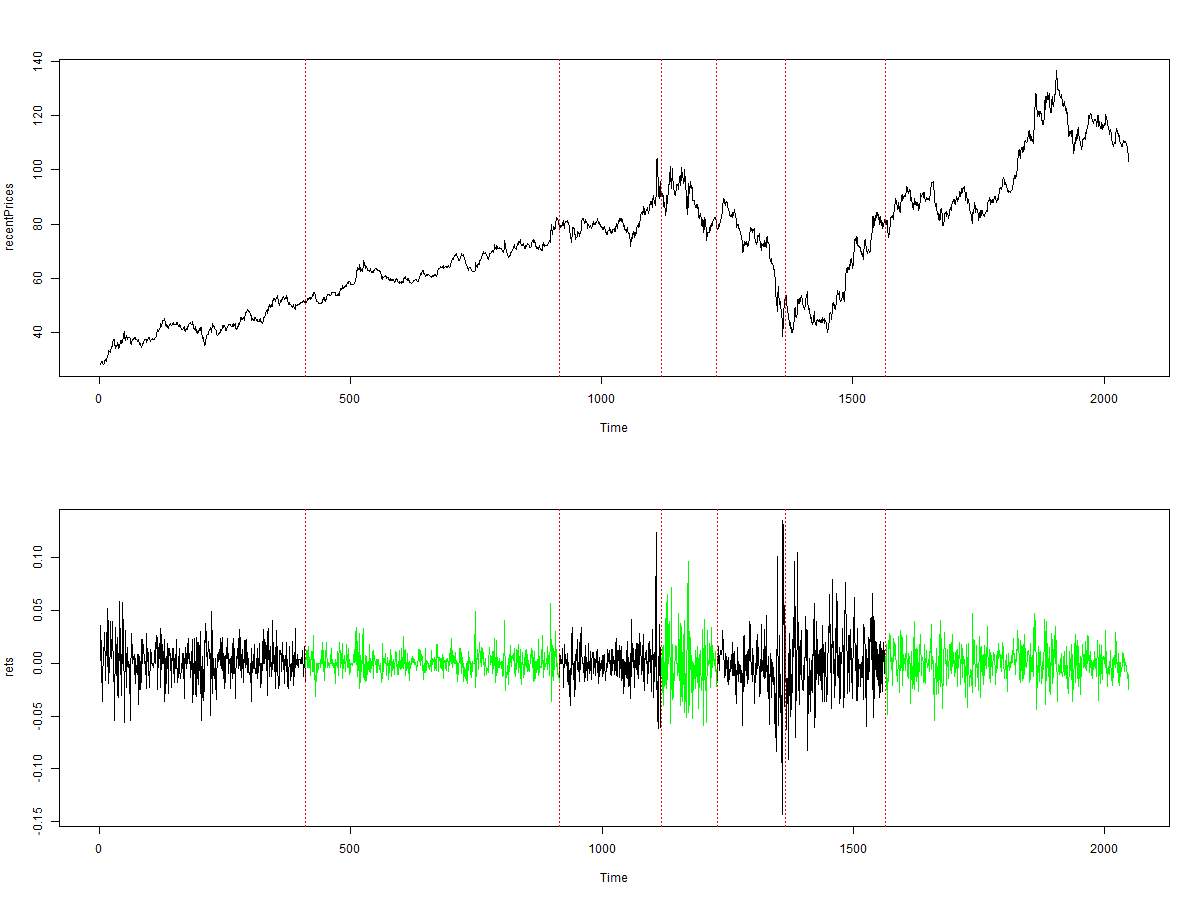
0002.HK
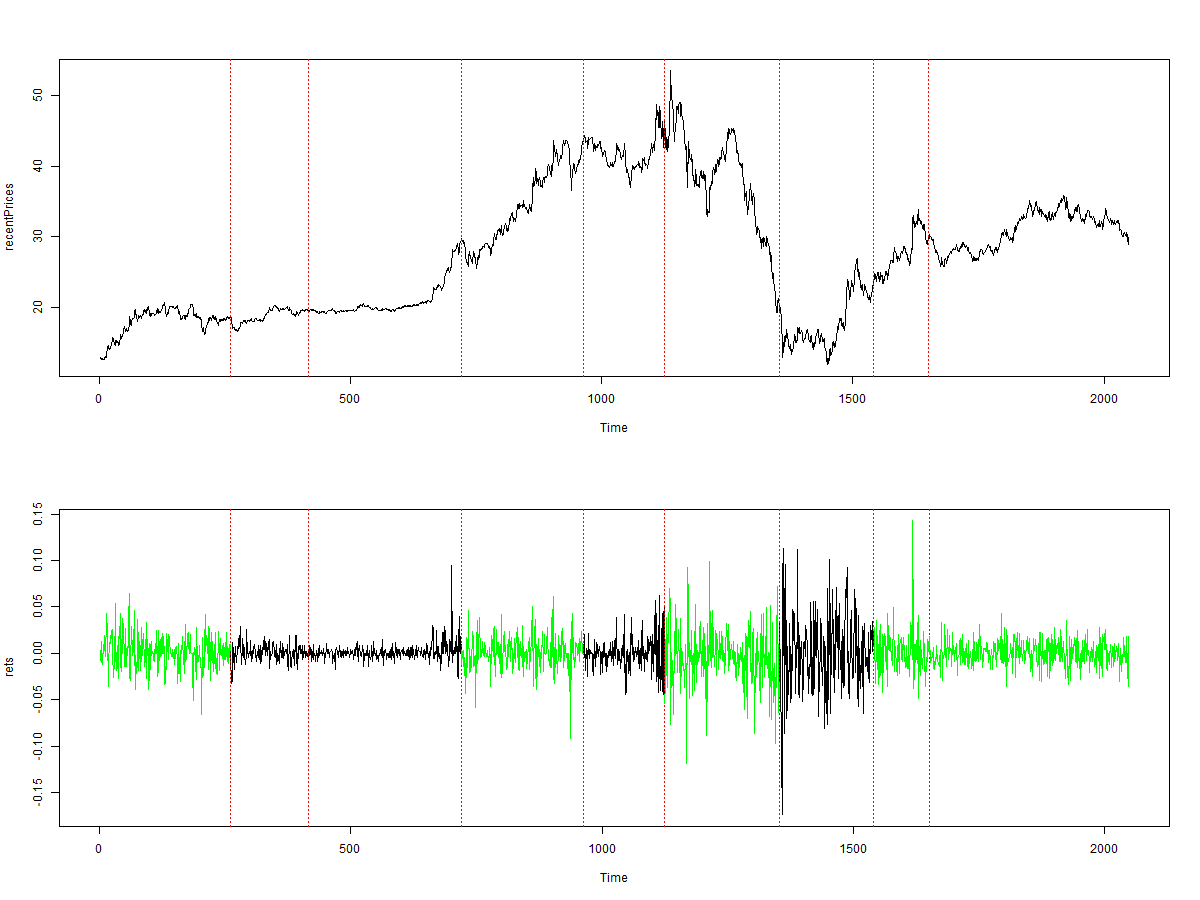
0003.HK
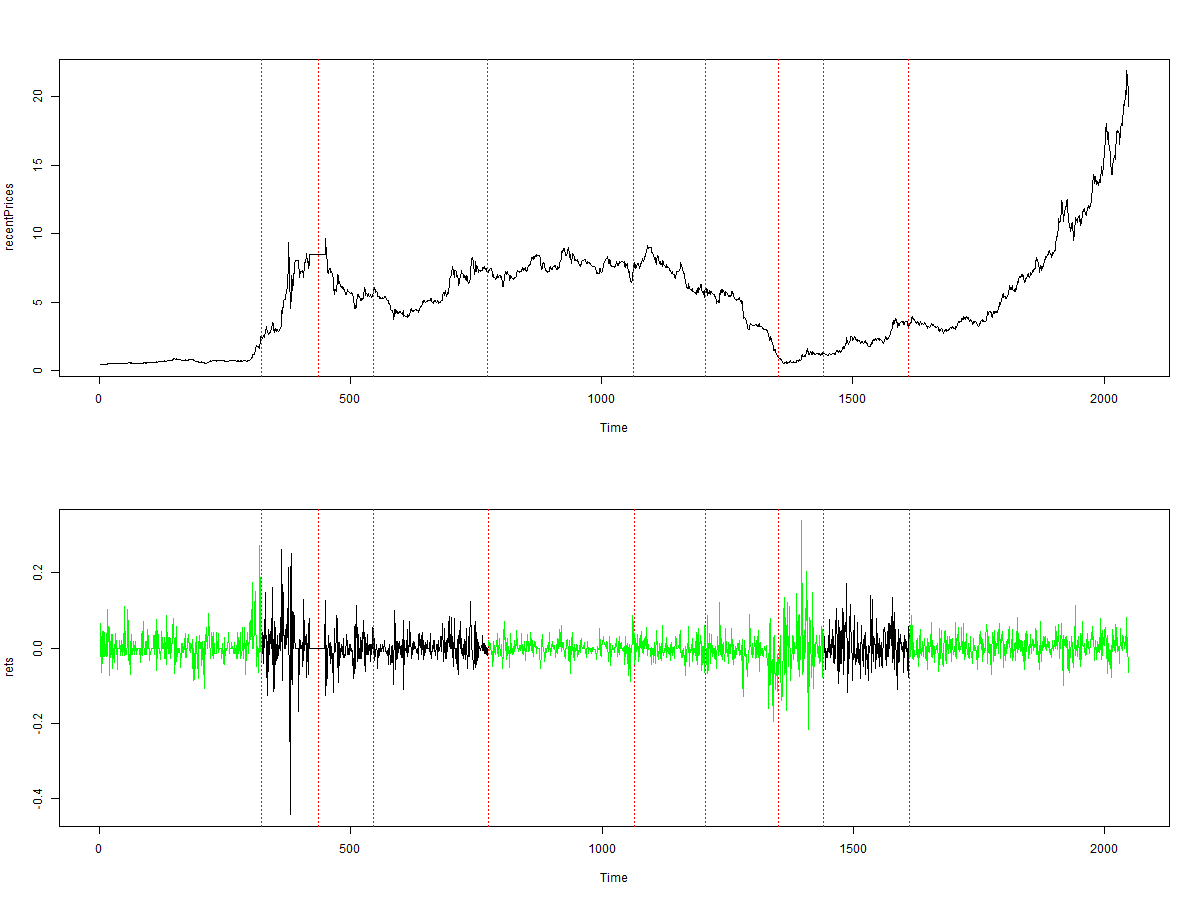
0004.HK

0005.HK
0006.HK

0010.HK
0011.HK

0012.HK
0013.HK
0014.HK
0016.HK
0017.HK
0019.HK

0020.HK
0023.HK
0027.HK
0034.HK
0038.HK
0041.HK
Like this post and wanna learn more?
Have a look at Knowledge rather than Hope: A Book for Retail Investors and Mathematical Finance Students
FinViz - an advanced stock screener (both for technical and fundamental traders)
FinViz - an advanced stock screener (both for technical and fundamental traders)