Seven years ago I tried to reproduce the results of "Foundations of Technical Analysis: Computational Algorithms, Statistical Inference, and Empirical Implementation" by Lo, Mamaysky and Wang with more recent data than they used. Lo et al come to the conclusion that the chart patterns are statistically significant (which does not yet mean their practical usability). My results shows that there is no statistical significance (anymore).
Does it really mean that the patterns do not work? Not necessarily, since Lo et al merely scrutinized the statistical significance of the next-day returns after a pattern completion. Traders usually hold a position somewhat longer, additionally the patterns are usually just an auxiliary Tool.
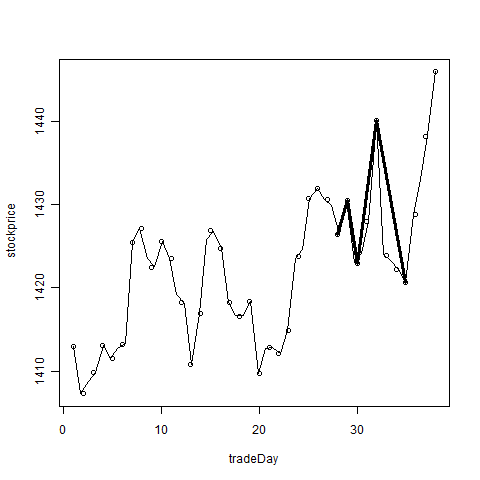
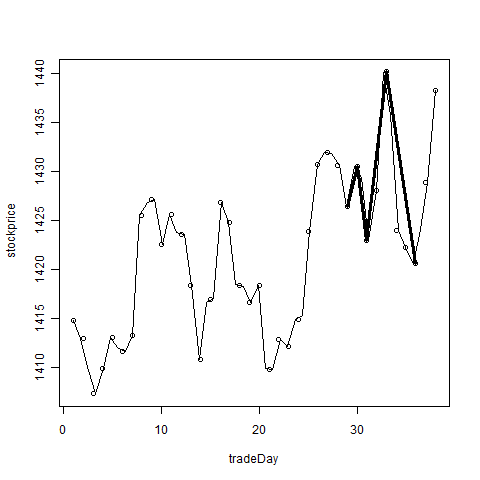
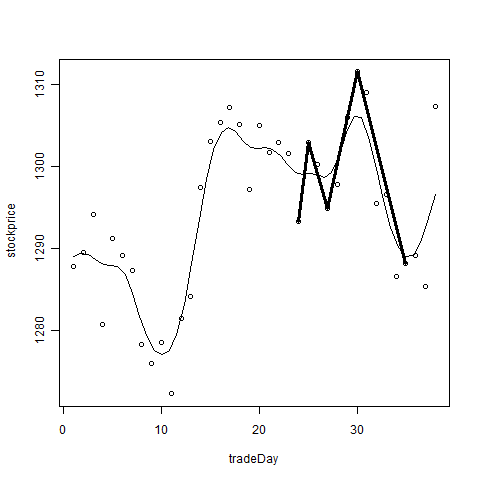
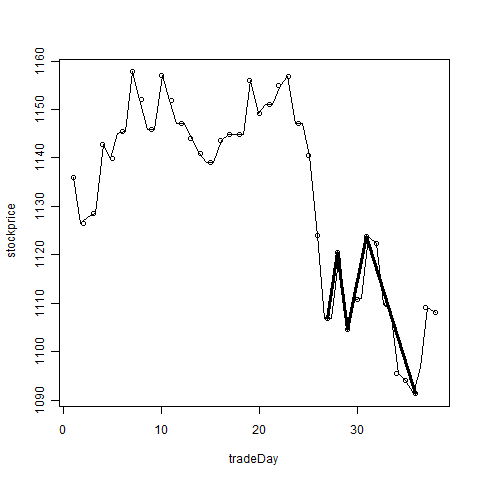
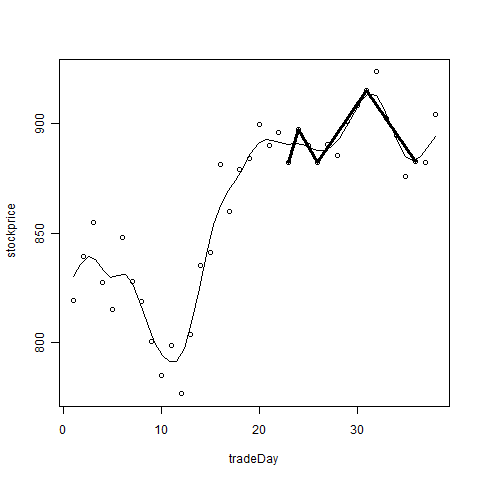
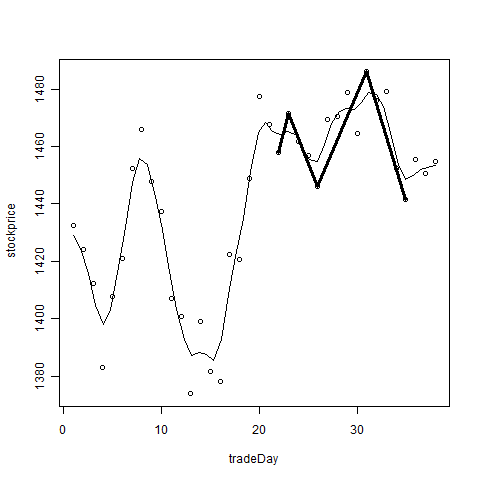
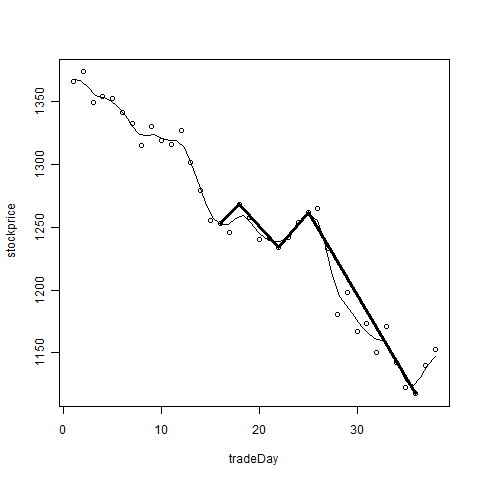
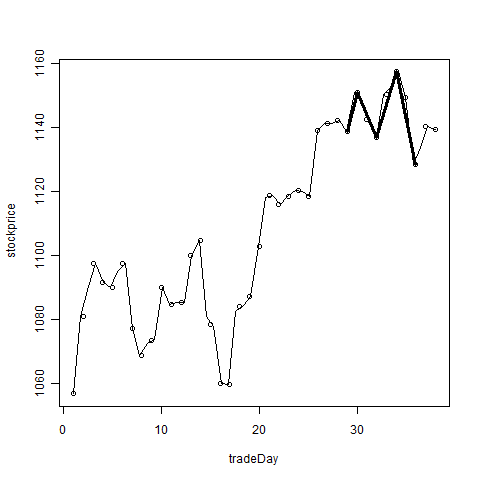
For technical detail see the draft of my report reproducing Lo et al 2000 and for practitioners I present then gallery of patterns (obtained on SP500 from 2003 till 2010) according to a method, described by Lo, Mamaysky and Wang.
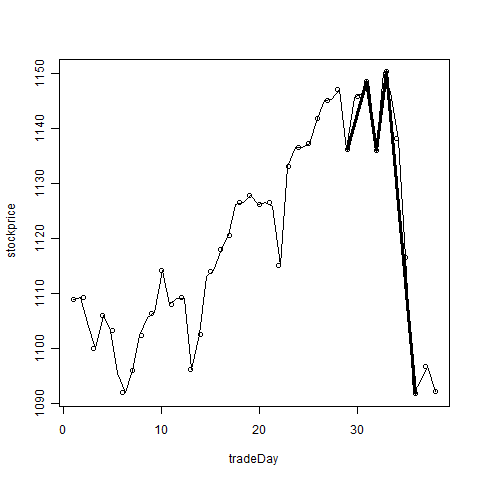
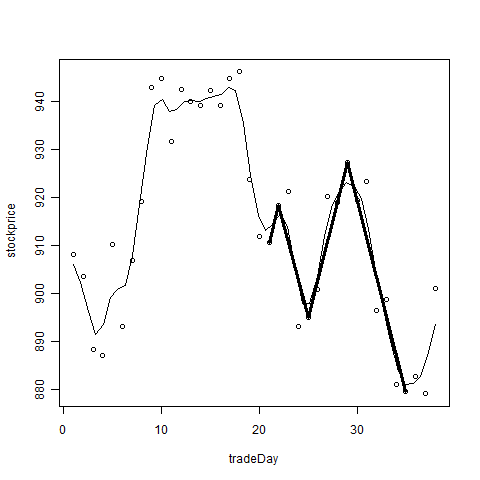
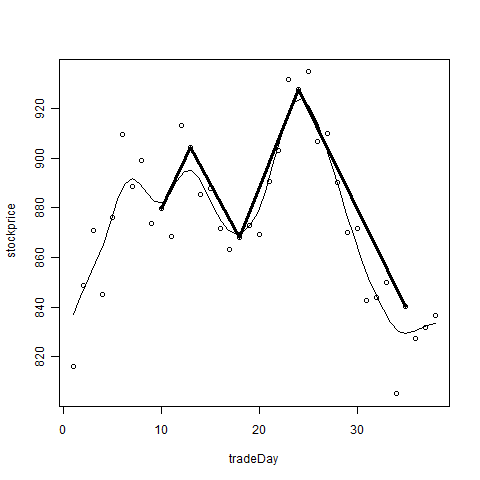
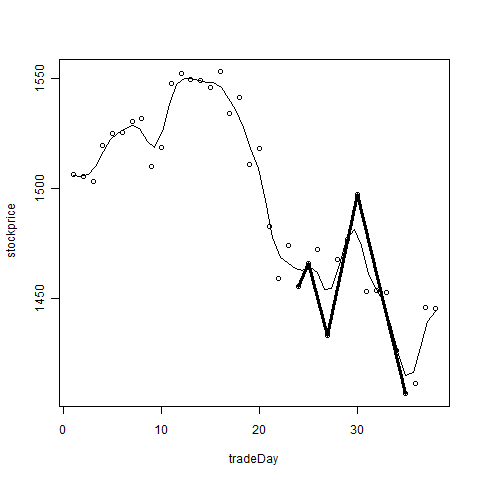
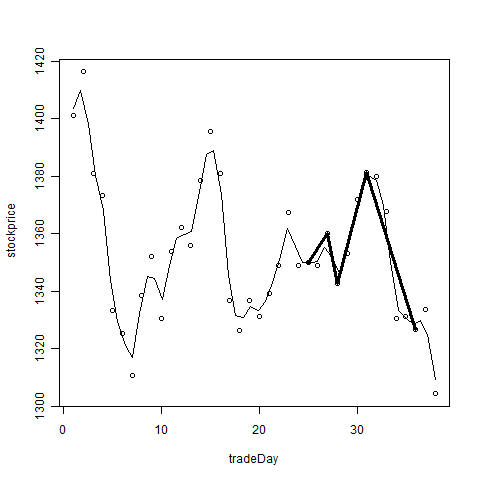
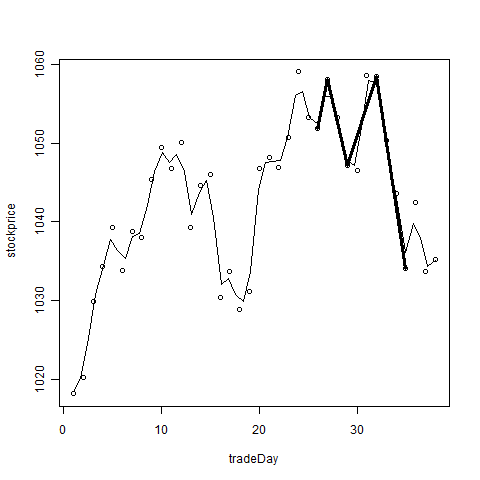
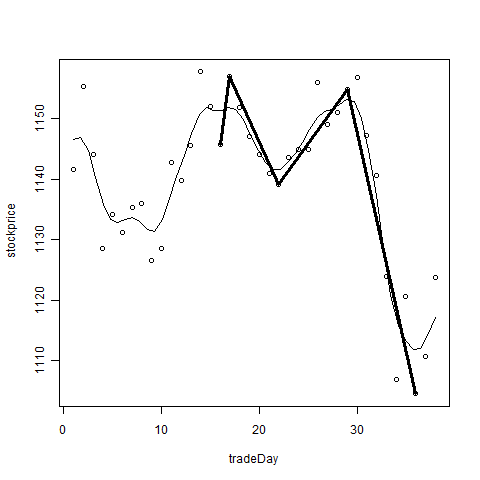
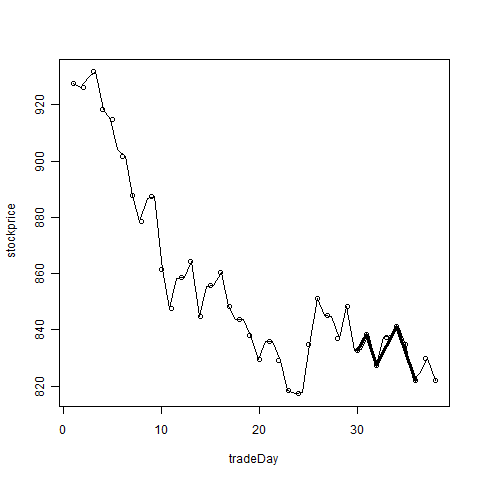
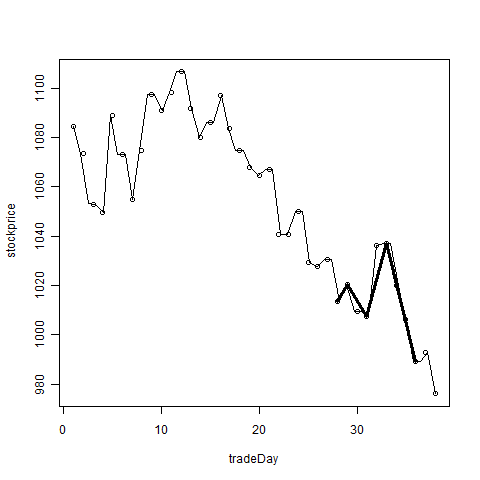
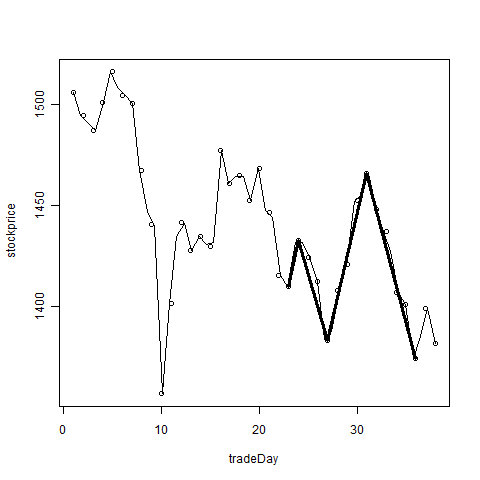
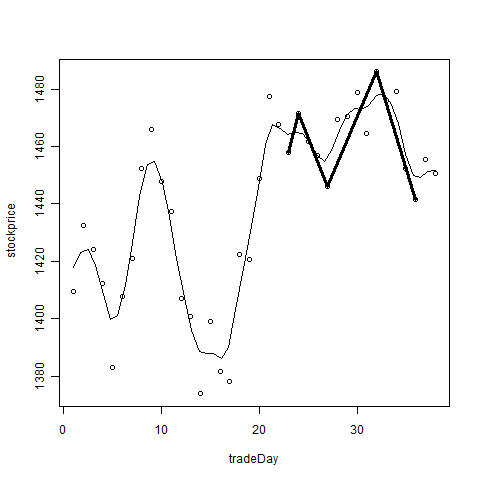
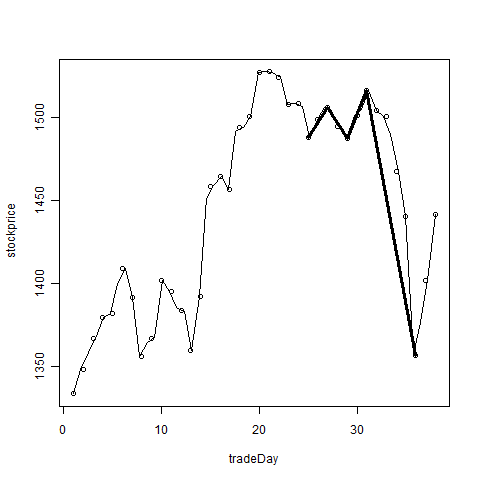
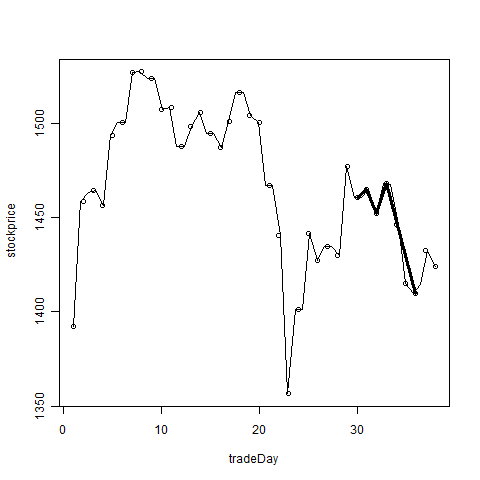
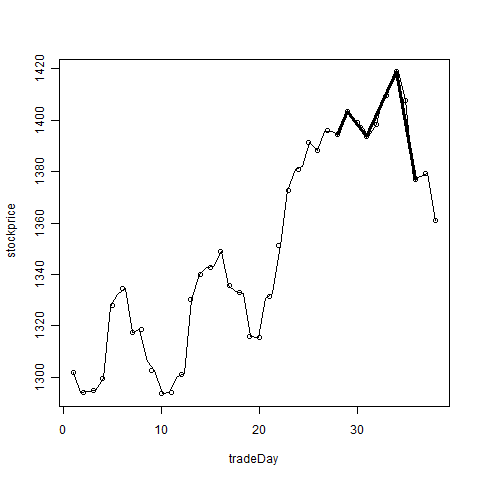
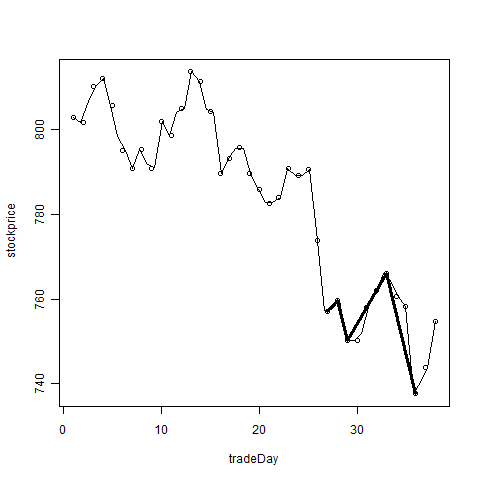
We start with Broadening bottoms (BBOT) pattern.


FinViz - an advanced stock screener (both for technical and fundamental traders)