I explain how to install QuantLib Python from sources and discuss how to fit a yield curve: PiecewiseLogCubicDiscount and NelsonSiegel.
QuantLib is a powerful opensource library for financial math, written in C++. Being a heart or brain if an IT-Solution, QuantLib is, however, just a part of it. And it is rather suboptimal to build the whole system in C++. Rather, we should have a opportunity to call QuantLib from other [scripting] languages. This is often done via SWIG. Although Python is not a only language, to which the [part of] Quantlib functionality is ported via SWIG, it is clearly favored. In particular, you find installation instruction on official QuantLib website only for Python. And it is actually not bad, since for a productive IT solution that runs day-to-day, Python is likely a good choice; in either case much better than Excel/QuantLibXL. Additionally, Python is de-facto standard language for deep learning tools and though I am pretty skeptical about the deep learning hype, it is often nice to have them (and more simple machine learning tools) at hand. Also for a yield curve fitting: Nelson-Siegel-[Svennson] is gloried for its parameter instability (which was fairly addressed in original paper), so it may be very useful to engage a kind of "artificial intellegence" to keep the time series of fitted parameters more or less stable (otherwise one loses their economic interpretation).
Anyway, let us look how we can feet a yield curve in Python-QuantLib.
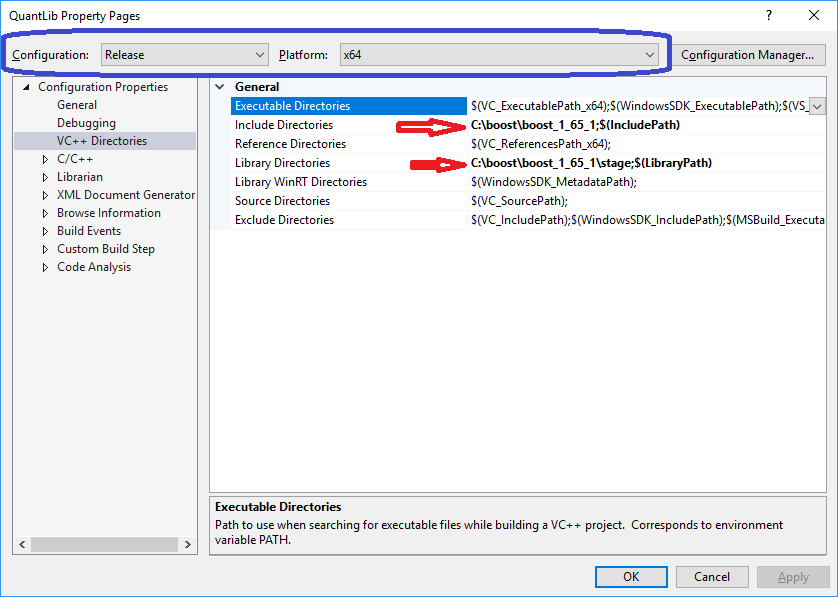
First of all you need to install it, just follow the instructions and keep in mind that (by default) the builder expects QuantLib-vc141-x64-mt.lib in QuantLib folder, which corresponds to the following configuration (on a x64 machine, of course :)).
We consider the same toy example as before for QuantLibXL. The Python code is as follows:
import numpy as np
import QuantLib as ql
today = ql.Date(8, 2, 2018)
ql.Settings.instance().evaluationDate = today
terminationDates = [ql.Date(4, 7, 2044), ql.Date(15, 2, 2028), ql.Date(14, 4, 2023)]
tenors = np.repeat(ql.Period(ql.Annual), 3) #allusion on R function rep()
calenders = np.repeat(ql.Germany(), 3)
termDateConvs = np.repeat(ql.Following, 3)
genRules = np.repeat(ql.DateGeneration.Backward, 3)
endOfMonths = np.repeat(False, 3)
firstDates = [ql.Date(27, 4, 2012), ql.Date(10, 1, 2018), ql.Date(2, 2, 2018)]
settlementDays = np.repeat(2, 3)
coupons = [0.025, 0.005, 0.0]
cleanPrices = [126.18, 98.18, 99.73]
faceValues = np.repeat(100.0, 3)
dayCounts = np.repeat(ql.ActualActual(), 3)
schedules = []
bonds = []
bondHelpers = []
for j in range(0, 3):
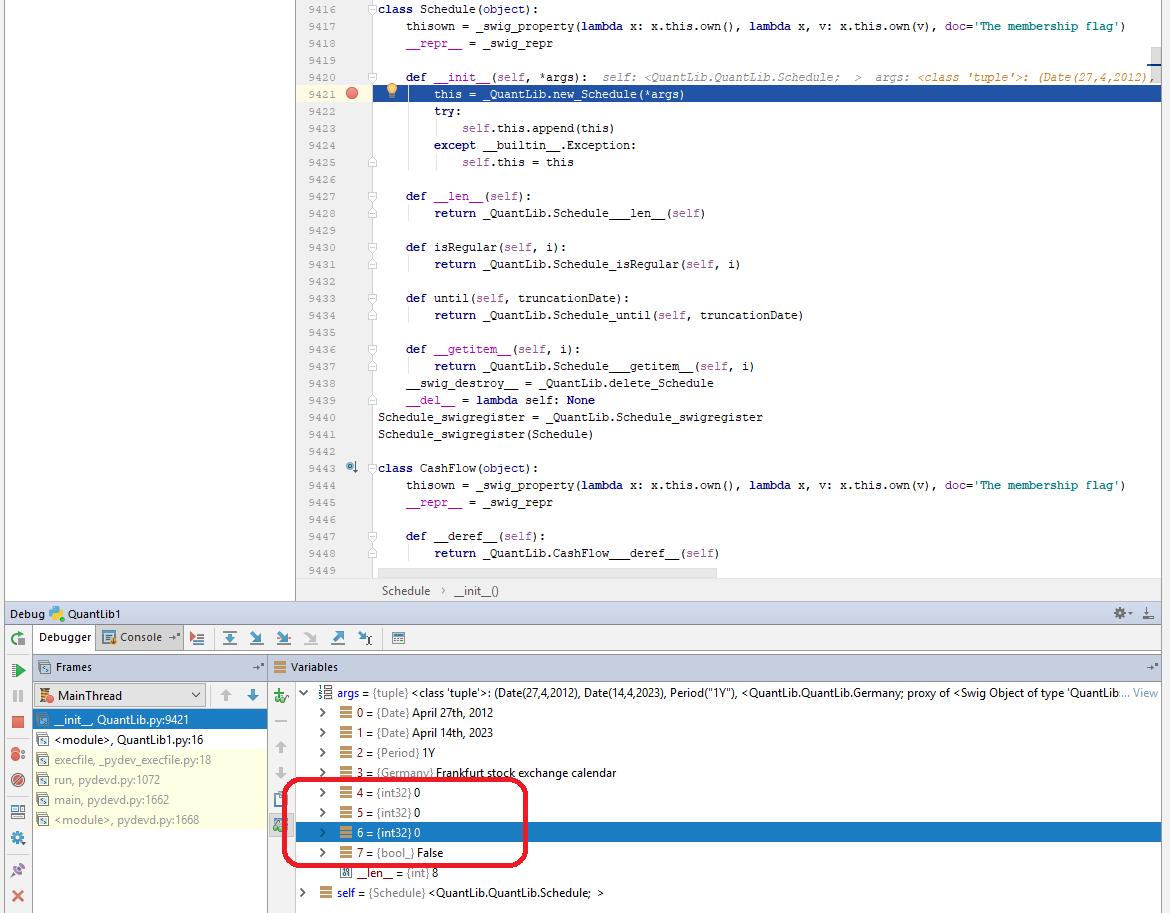
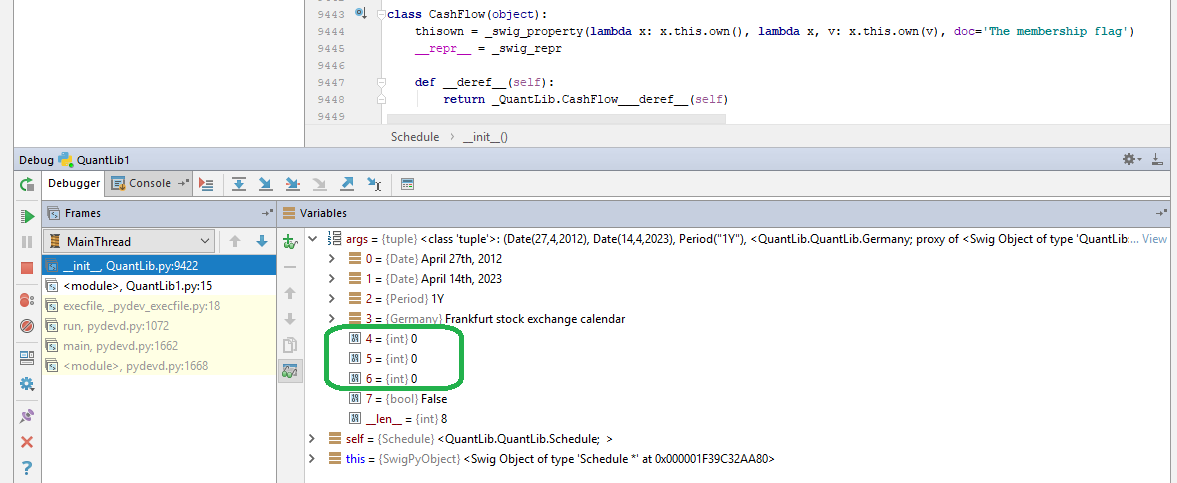
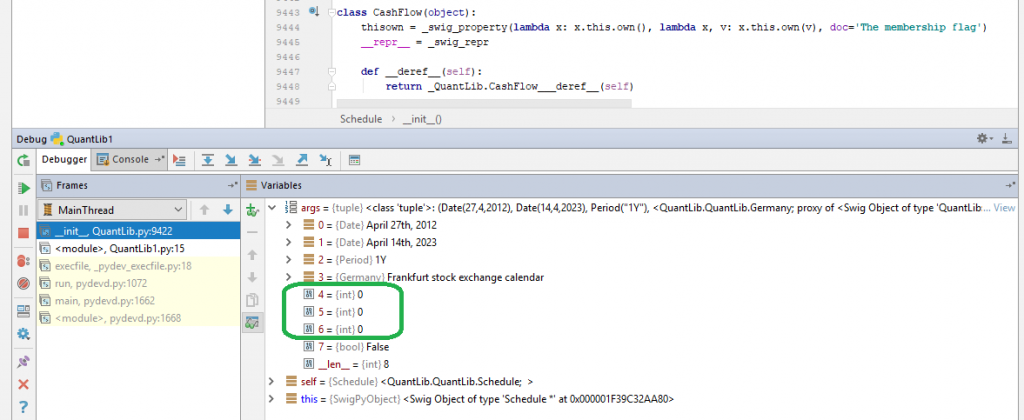
# without int() and bool() conversion it will not work due to int vs. int32_ and bool vs bool_
schedules.append(ql.Schedule(firstDates[j], terminationDates[j], tenors[j], calenders[j],
int(termDateConvs[j]), int(termDateConvs[j]), int(genRules[j]),
bool(endOfMonths[j])))
bonds.append(ql.FixedRateBond(int(settlementDays[j]), float(faceValues[j]), schedules[j],
[float(coupons[j])], dayCounts[j]))
bondHelpers.append(ql.BondHelper(ql.QuoteHandle(ql.SimpleQuote(float(cleanPrices[j]))), bonds[j]))
list(schedules[0])
list(schedules[1])
list(schedules[2])
print(bonds[0].bondYield(float(cleanPrices[0]), dayCounts[0], ql.Compounded, ql.Annual))
print(bonds[1].bondYield(float(cleanPrices[1]), dayCounts[1], ql.Compounded, ql.Annual))
print(bonds[2].bondYield(float(cleanPrices[2]), dayCounts[2], ql.Compounded, ql.Annual))
curveSettlementDays = 2
curveCalendar = ql.Germany()
curveDaycounter = ql.ActualActual()
#piecewise log cubic discount curve. Surprisingly there is no log-linear...
yieldCurve = ql.PiecewiseLogCubicDiscount(today, bondHelpers, curveDaycounter)
print(yieldCurve.discount(ql.Date(1, 3, 2019)))
print(yieldCurve.discount(ql.Date(1, 3, 2020)))
print(yieldCurve.discount(ql.Date(1, 3, 2035)))
##and Nelson-Siegel
curveFittingMethod = ql.NelsonSiegelFitting()
tolerance = 1.0e-5
iterations = 1000
yieldCurveNS = ql.FittedBondDiscountCurve(curveSettlementDays, curveCalendar, bondHelpers,
curveDaycounter, curveFittingMethod, tolerance, iterations)
res = yieldCurveNS.fitResults()
print(yieldCurveNS.discount(ql.Date(1, 3, 2019)))
print(yieldCurveNS.discount(ql.Date(1, 3, 2020)))
print(yieldCurveNS.discount(ql.Date(1, 3, 2035)))
As you can see, it is conceptually much closer to the "native" QuantLib than the QuantLibXL. In particular, we set Settings.instance().evaluationDate and construct Bonds directly from Schedules, whereas for QuantLibXL we need to costruct Schedules and then convert them to Legs, throwing away all payments before today.
Contrary to QuantLibXL, Python-QuantLib does support Nelson-Siegel fitting but surprisingly does not support LogLinear interpolation of the discount factors (at least I have not found any info in \QuantLib-SWIG-1.12\Python\QuantLib\QuantLib.py). So we use PiecewiseLogCubicDiscount.
Another surprise that first brought me to a confusion is that one need explicitly (re)-cast primitives (int, bool, float) to their original type when "restoring" them from a list. Otherwise you get an error that the parameters do not match to the SWIG interface!
It is a little bit weird for me, I will have a closer look on how Python holds primitive types (from my Java time I recall that they we always considered by value for the performance sake but Python is not Java).
Last but not least I am a little bit upset that I have not found (so far) a way to debug the QuantLib in Visual Studio when it is called from a Python script. Last time I dealt with SWIG before was almost 10 years ago and it was a Java-C++ binding. One could attach Eclipse process to the Visual Studio and then debug but in my case attaching both PyCharm and Python itself did not bring anything.
I will try to find the way and meanwhile you might have a look at excellent blog by Goutham Balaraman, if you want to learn more use cases.
FinViz - an advanced stock screener (both for technical and fundamental traders)