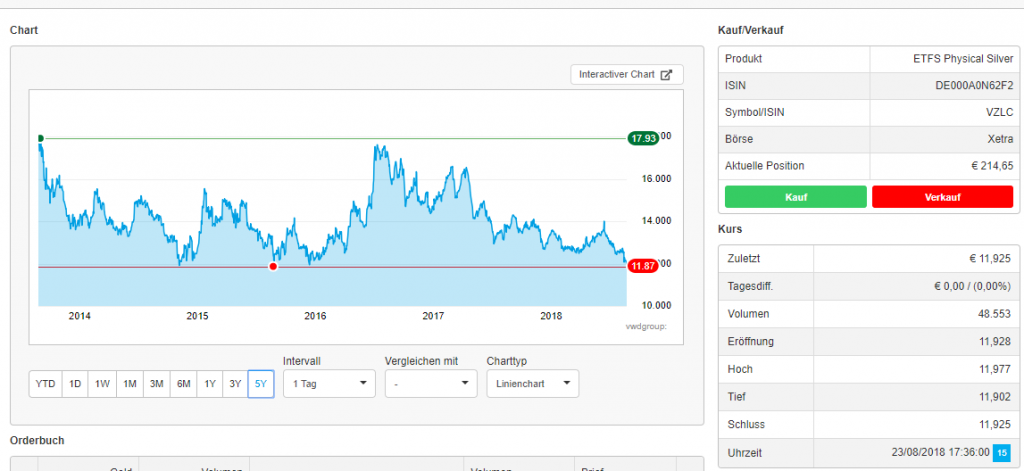
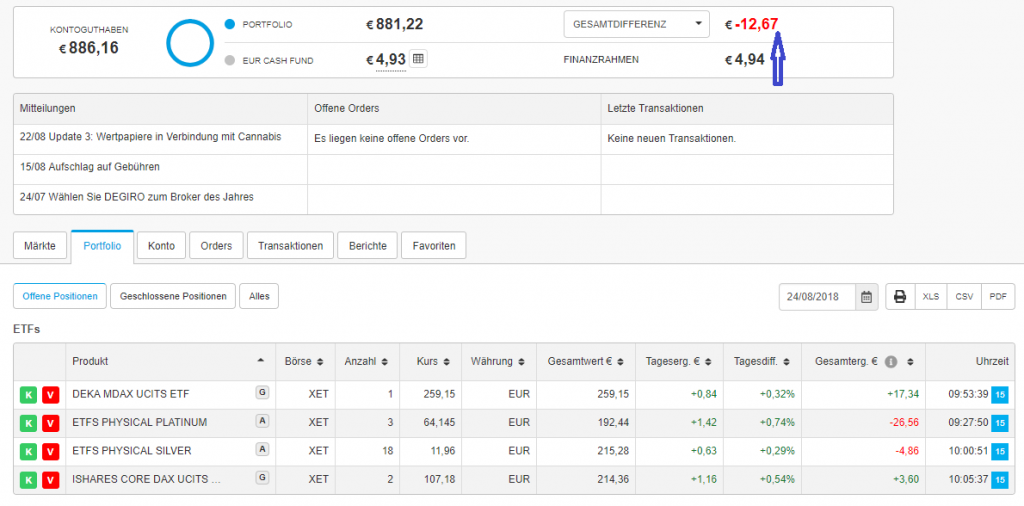
Elle, a 7-year old girl, confronted a hard choice this time: both German stocks and precious metals were relatively cheap. Finally, she decided to increase the position in silver, although before she has already bought a silver ETC a little bit prematurely.
It is not uncommon to affirm that "averaging" a (lossy) position is a bad idea. On the other hand one states that if one has planned buying in parts then it is a good practice. Well, we honestly admit, we did not planned it advance. The reason behind is simple: silver did reach (and repulsed from) a distinct long-term support level.
 Additionally, we believe in the mean reversion of commodity prices (see below).
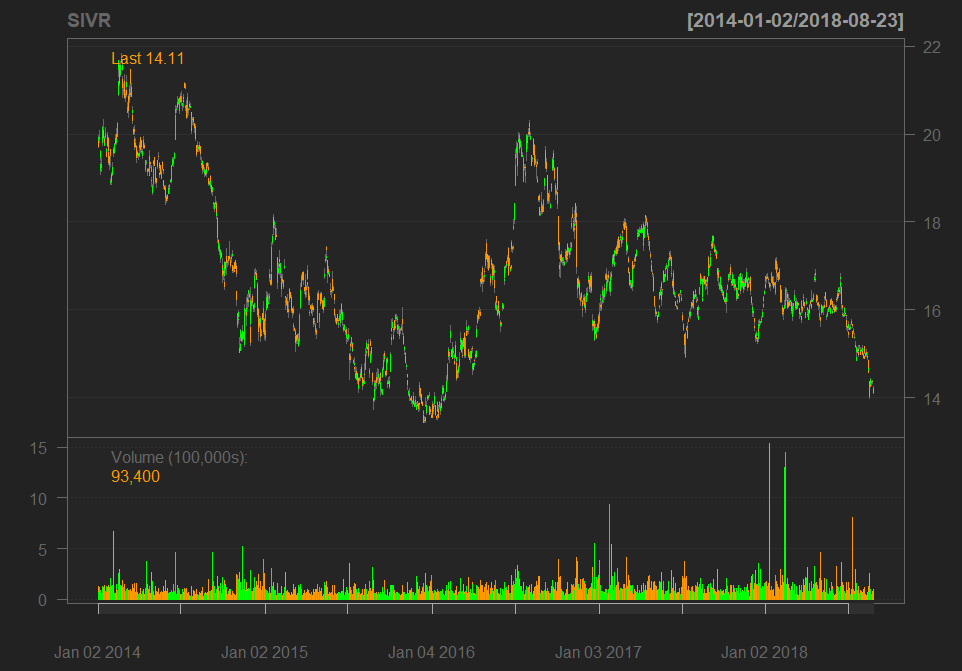
Yes, we are aware that the chart analysis of commodities should normally be done for the USD (not EUR) prices. And yes, formally, Silver price in US-dollar has not yet reached the 5-year minimum. Well, consider this as inflation adjustment 🙂

So far we have a significant exposure in silver and platinum, and they (not stocks) drove Elle's portfolio to a (temporarily) drawdown.
 But we plan to harvest the capital gains by Elle's Volljärigkeit (age of majority), so we have enough time to wait 🙂
This case was a good opportunity to explain Elle the idea of mean reversion.
Of course I have done it not mathematically but empirically. I told her: look, silver mining is normally a non-easy and costly technical process. The cheaper the silver gets, the more silver mines got closed. But the less silver there is, the more expensive it gets, thus the price shall grow sooner or later... then more and more mines will be opened and the silver price shall then fall... but we will close our position before 🙂
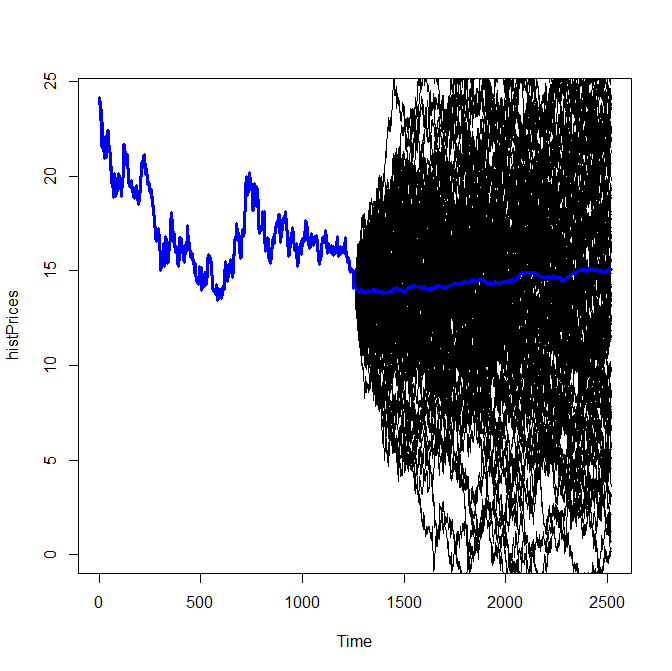
I also wanted to show he some nice graphs, usually I simulate the mean-reversion by means of the Ornstein-Uhlenbeck process. For this I use R-Package SNFI5 but this time it failed to fit the process parameters!
So we played with a simple ARIMA model. Of course it is unrealistic: it is too volatile and if we apply a naive ARIMA estimation (auto.arima()), we get I[ntegrated]-term, which spoils mean reversion. But anyway it was sufficient to draw a chart, showing to Elle that on average the silver price will grow (at least if we floor simulated negative prices with zero).

library(quantmod)
getSymbols("SIVR", to="2018-08-24")
chartSeries(SIVR, subset="last 5 years")

#simulate mean-reversion scenarios
idx = which(index(SIVR) > as.Date("2013/08/24"))
histPrices = (SIVR[idx])$SIVR.Close
##library("SMFI5")
##ouParams = est.ou(histPrices) #gives error, so use discrete AR(1) model
library(forecast)
arimaFit = auto.arima(histPrices) #gives ARIMA(1,1,1) with ar1=-0.8589, ma1=0.9060
ts.plot(histPrices, lwd=3, col="blue", xlim=c(0, 2*length(idx)), ylim=c(0, max(histPrices)))
N_SIMS = 100
meanPath = array(0.0, dim=length(idx))
for(j in 1:N_SIMS)
{
  x = simulate(arimaFit, nsim=length(idx))
  lines(x)
  x1 = as.numeric(x)
  x1[which(x1 < 0.0)] = 0.0
  meanPath = meanPath + x1
}
meanPath = meanPath / N_SIMS
x2 = c(as.numeric(histPrices), meanPath)
lines(x2, lwd=3, col="blue")
FinViz - an advanced stock screener (both for technical and fundamental traders)
