Support and resistance levels are quite popular among traders. Although they are implemented in many apps and services, an open source implementation of the algorithm is hardly available. We try to close the gap.
The source code in R is as follows
###################################################################
detectSupportResistance <- function(timeSeries, tolerance=0.01, nChunks=10, nPoints=3, plotChart=TRUE)
{
#detect maximums and minimums
N = length(timeSeries)
stp = floor(N / nChunks)
minz = array(0.0, dim=nChunks)
whichMinz = array(0, dim=nChunks)
maxz = array(0.0, dim=nChunks)
whichMaxz = array(0, dim=nChunks)
for(j in 1:(nChunks-1))
{
lft = (j-1)*stp + 1 #left and right elements of each chunk
rght = j*stp
whichMinz[j] = which.min(timeSeries[lft:rght]) + lft
minz[j] = min(timeSeries[lft:rght])
whichMaxz[j] = which.max(timeSeries[lft:rght]) + lft
maxz[j] = max(timeSeries[lft:rght])
}
#last chunk
lft = j*stp + 1 #left and right elements of each chunk
rght = N
whichMinz[nChunks] = which.min(timeSeries[lft:rght]) + lft
minz[nChunks] = min(timeSeries[lft:rght])
whichMaxz[nChunks] = which.max(timeSeries[lft:rght]) + lft
maxz[nChunks] = max(timeSeries[lft:rght])
result = list()
result[["minima"]] = NULL
result[["minimaAt"]] = NULL
result[["maxima"]] = NULL
result[["maximaAt"]] = NULL
span = tolerance*(max(maxz) - min(minz))
rang = order(minz)[1:nPoints]
if((minz[rang[nPoints]] - minz[rang[1]]) <= span)
{
result[["minima"]] = minz[rang[1:nPoints]]
result[["minimaAt"]] = whichMinz[rang[1:nPoints]]
}
rang = order(maxz, decreasing = TRUE)[1:nPoints]
if((maxz[rang[1]] - maxz[rang[nPoints]]) <= span)
{
result[["maxima"]] = maxz[rang[1:nPoints]]
result[["maximaAt"]] = whichMaxz[rang[1:nPoints]]
}
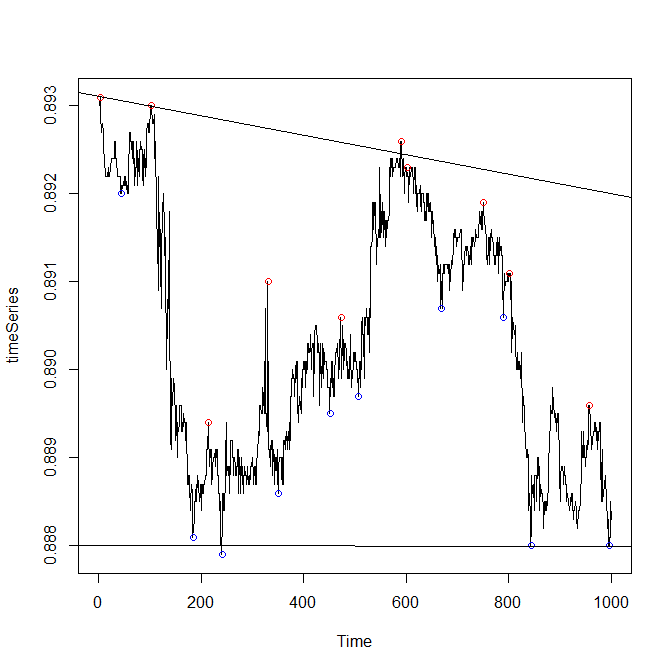
if(plotChart)
{
ts.plot(timeSeries)
points(whichMinz, minz, col="blue")
points(whichMaxz, maxz, col="red")
if(!is.null(result[["minima"]]) && !is.null(result[["minimaAt"]]))
abline(lm(result[["minima"]] ~ result[["minimaAt"]]))
if(!is.null(result[["maxima"]]) && !is.null(result[["maximaAt"]]))
abline(lm(result[["maxima"]] ~ result[["maximaAt"]]))
}
return(result)
}
The function parameters are the following:
timeSeries a univariate numeric vector of (evenly-sampled) price observation. If you use OHLC prices, you may separately fit support and resistance levels to, respectively, lows and highs.
tolerance Virtually no support or resistance level is perfectly horizontal. Thus we allow some tolerance (in percentage of max(timeSeries)-min(timeSeries)) for the difference of the first and the last extreme. The default value of 0.01 maybe too restrictive, so you may try 0.02 and 0.03
nChunks Number of chunks to split the timeSeries. At each chunk the maximum and minimum will be detected.
If one does not split the time series in chunks but just detects the first largest extreme, second largest extreme, etc, these extreme values will likely be too close to each other. Generally, it is difficult to recommend the "optimal" number of chunks but 10 seems to be a good trade-off if the time series contains at least 200 observations.
nPoints How many extremes to consider by fitting support or resistance level. It is commonly believed that a level should fit to at least three extremes (and it is really hard to fit more than three, esp. if tolerance is low). Thus the default value of 3 is really not bad.
plotChartWhether to plot the results or not.
This video demonstrates how the routine fits the levels to 1min data for EURUSD close prices
detectSupportResistance(EURUSDoneMin, tolerance=0.03, nChunks=12, nPoints=3, plotChart=TRUE)
FinViz - an advanced stock screener (both for technical and fundamental traders)