A brief instruction:
0. Update your Nvidia graphic card driver (just driver; you need NOT install/update CUDA but make sure that your card has cuda compute capability >= 3.5)
1. install Anaconda (release Anaconda3-2020.11 from anaconda.org)
2. open anaconda prompt and run
>conda create -n tfgpu210p37 python==3.7
>conda activate tfgpu210p37
>conda install cudatoolkit=10.1 cudnn=7.6 -c=conda-forge
>conda install -c anaconda tensorflow-gpu
3. in R run
>install.packages("keras")
>reticulate::use_condaenv("tfgpu210p37", required = TRUE)
>library(keras)
4. If you wanna understand what is going on under the hood, read further
Continue reading "Howto Install Tensorflow-GPU with Keras in R – A manual that worked on 2021.02.20 (and likely will work in future)"
Tag: R
Reproducing a Pseudo-Random Walk down the Wall Street
Malkiel affirms that the stock returns follow the random walk. Lo and MacKinlay retort they do not.
In this post I show how a mean-reverting process can be efficiently disguised as a random walk. Most likely, the market does follow a similar disguise-pattern (at least sometimes). Continue reading "Reproducing a Pseudo-Random Walk down the Wall Street"
PCA, Autoencoders and the Feasibility of Stockpicking
The idea that the stock picking makes less and less sense since the markets are more and more driven by the macroeconomic factors is quite popular.
Especially right now, as the markets are falling (like on todays FEd decision to increase the rates), this idea may seem to be plausible. However, we show that in the long term the stocks do show enough of individuality. Continue reading "PCA, Autoencoders and the Feasibility of Stockpicking"
The Highest Volatility in October? Don’t trust a Superficial Statistics!
A recent post "Fasten your seat belt for stocks: October is almost here" on MarketWatch, repeated by Morningstar and shared in my social networks may make an illusion that it is likely to expect high(est) volatility in October. A little bit more detailed statistical analysis shows that such expectation is superficial.
A more general (and very old) lesson from this case: the statistical analysis is much more than a primitive consideration of the mean values in groups. And of course: don't trust provoking titles. 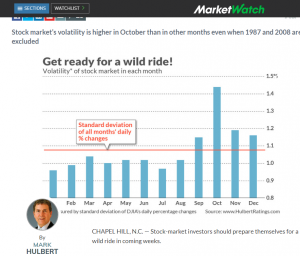 Continue reading "The Highest Volatility in October? Don’t trust a Superficial Statistics!"
Pitfalls of Nelson-Siegel Yield Curve Modeling – Part II – what ML and AI can[not] do
In our previous post on Nelson-Siegel model we have shown some pitfalls of it. In this follow-up we will discuss how to circumvent them and how machine learning and artificial intelligence can[not] help. Continue reading "Pitfalls of Nelson-Siegel Yield Curve Modeling – Part II – what ML and AI can[not] do"
Pitfalls of Nelson-Siegel Yield Curve Modeling – Part I
The Nelson-Siegel-[Svensson] Model is a common approach to fit a yield curve. Its popularity might be explained with economic interpretability of its parameters but most likely it is because the European Central Bank uses it. However, what may do for ECB will not necessarily work in all cases: the model parameters are sometimes extremely unstable and fail to converge.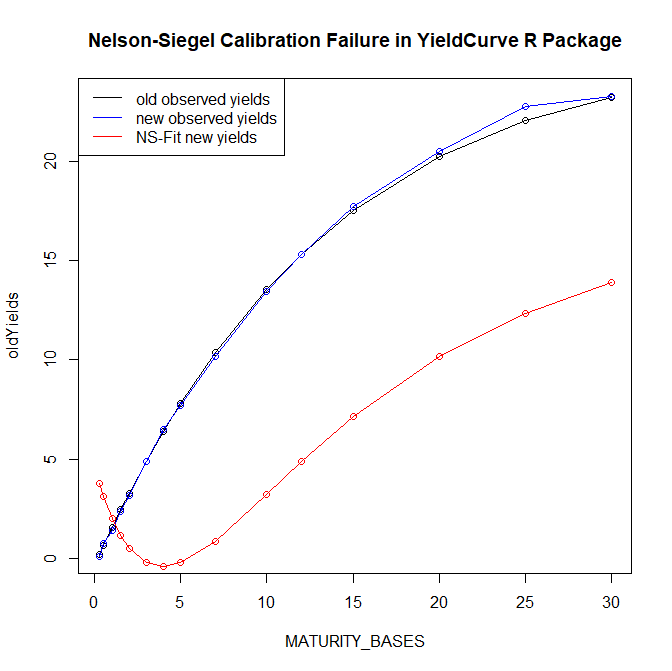 Continue reading "Pitfalls of Nelson-Siegel Yield Curve Modeling – Part I"
Classifying Time Series with Keras in R : A Step-by-Step Example
We test different kinds of neural network (vanilla feedforward, convolutional-1D and LSTM) to distinguish samples, which are generated from two different time series models. Contrary to a (naive) expectation, conv1D does much better job than the LSTM. Continue reading "Classifying Time Series with Keras in R : A Step-by-Step Example"
R code to detect support and resistance levels
Support and resistance levels are quite popular among traders. Although they are implemented in many apps and services, an open source implementation of the algorithm is hardly available. We try to close the gap.
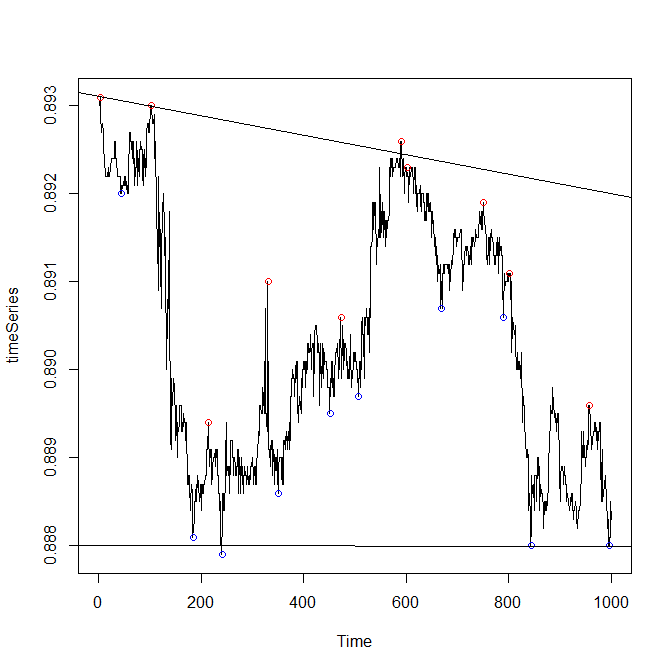 Continue reading "R code to detect support and resistance levels"
Optimal Number of Trades: better less but better
A very important question, which every trader or investor encounters is how many trades to commit or how many stocks to hold in portfolio. Whereas the law of the large numbers readily gives a [naive] answer "the more the better", in practice the answer is often better less but better. Continue reading "Optimal Number of Trades: better less but better"
R-script for Fixer.io – get FX rates in R for 31 currencies
Even if you are not a Forex trader, it is often necessarily to get currency exchange rates, e.g. if you trade [the options on] foreign stocks. Fixer.io provides daily FX-rates from European Central Bank for 31 currencies via JSON API. We present a script to get data in R.
Continue reading "R-script for Fixer.io – get FX rates in R for 31 currencies"