A year ago the Business Insider reported about the "the stocks market's robot revolution". Whereas the title was crying, a summary was more reserved: The fund has outperformed the S&P 500 so far, but a much longer trading period is needed to assess whether it can truly offer market-beating returns. I scheduled in my calendar to have a look at this fund in a year, telling a colleague, who pointed me on AIEQ that I would bet a bottle of whisky (bot not a farm!) that this ETF will perform worse than its benchmark. I turned out to be right.
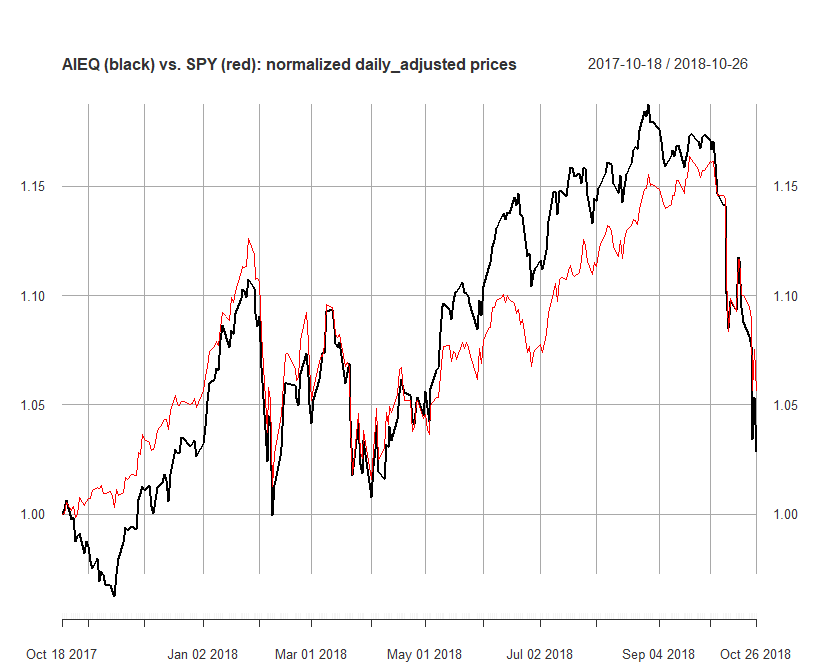 Continue reading "AIEQ the AI Powered Equity ETF: Artificial Intelligence is Still Losing to a Natural Stupidity"
Category: AmericanStocks
The Highest Volatility in October? Don’t trust a Superficial Statistics!
A recent post "Fasten your seat belt for stocks: October is almost here" on MarketWatch, repeated by Morningstar and shared in my social networks may make an illusion that it is likely to expect high(est) volatility in October. A little bit more detailed statistical analysis shows that such expectation is superficial.
A more general (and very old) lesson from this case: the statistical analysis is much more than a primitive consideration of the mean values in groups. And of course: don't trust provoking titles. 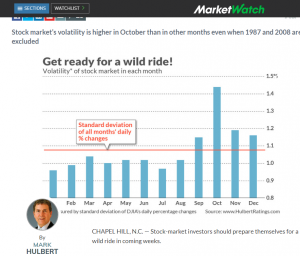 Continue reading "The Highest Volatility in October? Don’t trust a Superficial Statistics!"
Yahoo Finance Live Feeds in Excel after their API Discontinuation in November 2017
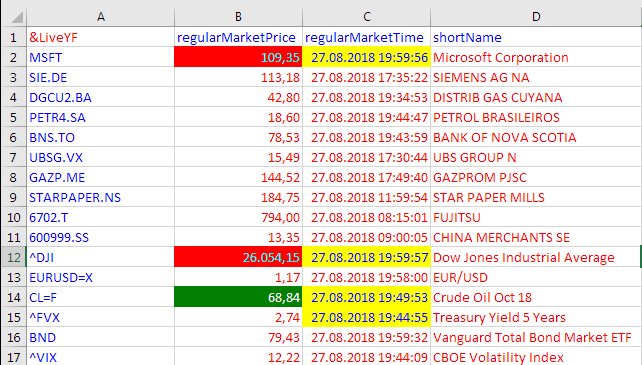
On the fateful Wednesday of November 1st, 2017 Yahoo decided to stop their – until then – free service of delivering real time market data as a text stream through a special URL. For hundreds of businesses and individuals who had relied for years on Yahoo's benevolent free service, this single action meant only one thing: Instant death! Continue reading "Yahoo Finance Live Feeds in Excel after their API Discontinuation in November 2017"
Your Fundamental Analysis is Only as Good as Your Data are: The Example of NWL
Whereas the opinions on the usefulness of technical analysis are highly controversial, it is generally agreed that the fundamental analysis does make sense. Value investing, e.g. the choice of companies with low p/e and p/b coefficients but high RoE and EBIT-Margin is not an uncommon approach. However, the data quality and creative data interpretation are critical. Otherwise one yields yet another GiGo: Garbage in, Garbage out! Continue reading "Your Fundamental Analysis is Only as Good as Your Data are: The Example of NWL"
What You Have Missed by Not Buying Our Stocklist for just $5 – Part II: Statistical significance
Two months ago we suggested you to buy a list of stocks, carefully selected from SP500 index on both fundamental and technical criteria. One month later we have published the results: though our stocklist has clearly beaten SPY there were no evidences of formal statistical significance. Now there are. Moreover, you have an opportunity to buy our next stockpicking report just for $10. Continue reading "What You Have Missed by Not Buying Our Stocklist for just $5 – Part II: Statistical significance"
What You Have Missed by Not Buying Our Stocklist for just $5
One month ago we screened all stocks from SP 500 index and suggested busy investors to get rid of information overload and purchase our stock list just for 5 USD. Only a few investors considered our offer, which has brought about 3% return within a month, whereas SP 500 return stagnated around zero. Continue reading "What You Have Missed by Not Buying Our Stocklist for just $5"
Investor, get rid of information overload!
Retail investors are overwhelmed with information. Meanwhile the payload of these numerous analytics and market reviews is zero or even negative. Is a passive investment in an index ETF a solution to this problem? Yes, but not necessarily the best one. We provide a short list of S&P 500 stocks with good fundamentals, low volatilities and correlations and nice charts from technical point of view. Continue reading "Investor, get rid of information overload!"
JuniorDepot6a – Suboptimal Market Timing and 2nd Stockpicking Attempt with Viacom
Elle keeps practicing to read the charts and recently she found a strong resistance level for DAX at 12600. So we partially went to cash, however, somewhat prematurely. We tried to turn this setback into an opportunity and bought Viacom (VIAB) stocks... which dropped by -6% today. Still we hold it for a fundamentally good investment and will keep the stock. Continue reading "JuniorDepot6a – Suboptimal Market Timing and 2nd Stockpicking Attempt with Viacom"
A Quick but Insightful Look at Stock Fundamental Data Summary
StockPup.com generously shares the fundamental data for several hundred stocks. However, there are a lot of outliers and missing data. We present some interesting results for the market summary and the long-term trends.
Continue reading "A Quick but Insightful Look at Stock Fundamental Data Summary"
Does Stock Picking Still Make Sense? Yes, it does!
Many "experts", at least in Germany, state nowadays: currently the markets are driven by macroeconomic factors (FED and ECB policies, quantitative easing, etc) thus the stock picking does not make sense. We show that it still does. Continue reading "Does Stock Picking Still Make Sense? Yes, it does!"