The Nelson-Siegel-[Svensson] Model is a common approach to fit a yield curve. Its popularity might be explained with economic interpretability of its parameters but most likely it is because the European Central Bank uses it. However, what may do for ECB will not necessarily work in all cases: the model parameters are sometimes extremely unstable and fail to converge.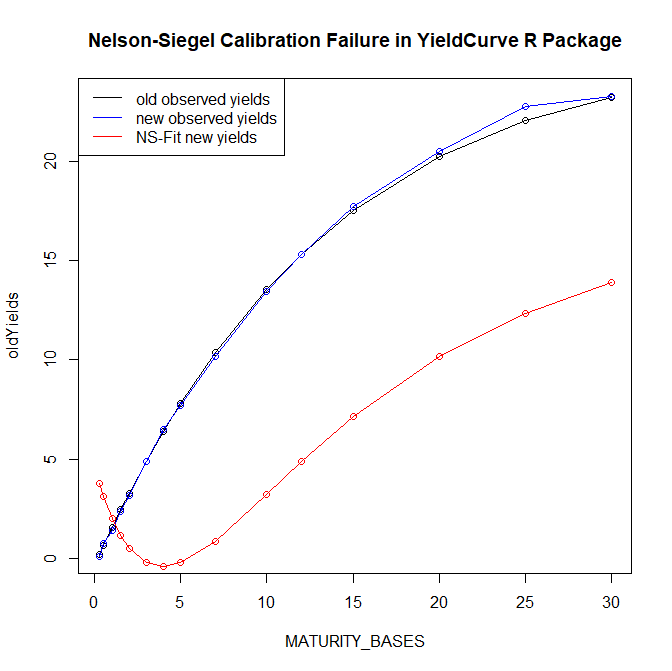
In their original paper Nelson and Siegel got started with forward rates and then derived a formula for the yield-to-maturity curve, which is written in original notation as follows:
![R(m) = \beta_0 + (\beta_1 + \beta_2) \cdot [1-\exp{(-m / \tau)}]/(m/\tau) - \beta_2 \cdot \exp{(-m/\tau)}](https://s0.wp.com/latex.php?latex=R%28m%29+%3D+%5Cbeta_0+%2B+%28%5Cbeta_1+%2B+%5Cbeta_2%29+%5Ccdot+%5B1-%5Cexp%7B%28-m+%2F+%5Ctau%29%7D%5D%2F%28m%2F%5Ctau%29+-+%5Cbeta_2+%5Ccdot+%5Cexp%7B%28-m%2F%5Ctau%29%7D&bg=ffffff&fg=000&s=0&c=20201002)
In more recent literature (and software) they often write 


The Nelson-Siegel model, being parsimonious, can generate a rich universe of yield curves, the following video provides some insights.
However, being used naively, it often loses its economic interpretability or, even worse, fails to converge (whereas this might be considered not as worse but as better since the problem at least becomes clearly visible).
Such case is shown at the figure above and the following R-code reproduces it.
#########reproduce failure of NelsonSiegel fit in YieldCurve R package##########
library(YieldCurve)
MATURITY_BASES = c(0.25, 0.5, 1, 1.5, 2, 3, 4, 5, 7, 10, 12, 15, 20, 25, 30) #in Years
oldYields = c(0.1826617,  0.6497298,  1.5601950,  2.4399275,  3.2898945,  4.9042541,
              6.4104352,  7.8151653, 10.3451705, 13.5253214, 15.2930494, 17.5004203,
              20.2243677, 22.0500893, 23.2344912)
newMats = MATURITY_BASES - 1.0/365.0
newYields = c(0.1145903,  0.7609312,  1.4130920,  2.3609728,  3.1862108,  4.8986307,
              6.5070496,  7.7038321, 10.1763859, 13.4354299, 15.3102582, 17.7235416,
              20.4758260, 22.7326552, 23.2787166)
NSParameters <- as.xts(Nelson.Siegel( rate= newYields, maturity=newMats), order.by=c(as.Date("2018-07-07")))
newNsYields = NSrates(NSParameters, newMats)
plot(MATURITY_BASES, oldYields, main="Nelson-Siegel Calibration Failure in YieldCurve R Package")
lines(MATURITY_BASES, oldYields)
points(newMats, newYields, col="blue")
lines(newMats, newYields, col="blue")
points(newMats, newNsYields, col="red")
lines(newMats, newNsYields, col="red")
legend("topleft",legend=c("old observed yields","new observed yields","NS-Fit new yields"), col=c("black","blue", "red"),lty=1)
Note that newMat[urities] is one day shorter than MATURITY_BASES because this code imitates a frequent use case, as current yield curve is compared with the yesterday curve. In a sense, it is a toy example since we already have zero yields for given maturities and "merely" need to connect the dots. In reality we usually have to do with coupon bonds, which makes things more complex.
You might think that the convergence failures due to a poor implementation of YieldCurve package. Well, I would speak not about a poor implementation but rather about a strong dependence on the used numerical methods, as the next more realistic example shows.
[source language="CPP"]
#include <ql/qldefines.hpp>
#ifdef BOOST_MSVC
# include <ql/auto_link.hpp>
#endif
#include <ql/termstructures/yield/fittedbonddiscountcurve.hpp>
#include <ql/termstructures/yield/piecewiseyieldcurve.hpp>
#include <ql/termstructures/yield/flatforward.hpp>
#include <ql/termstructures/yield/bondhelpers.hpp>
#include <ql/termstructures/yield/nonlinearfittingmethods.hpp>
#include <ql/pricingengines/bond/bondfunctions.hpp>
#include <ql/time/calendars/target.hpp>
#include <ql/time/daycounters/simpledaycounter.hpp>
#include <boost/timer.hpp>
#include <iostream>
#include <iomanip>
#include <boost/make_shared.hpp>
#include "ql/time/daycounters/thirty360.hpp"
#include "ql/time/daycounters/actualactual.hpp"
#include "ql/math/optimization/conjugategradient.hpp"
#include "ql/math/optimization/simplex.hpp"
using namespace QuantLib;
int main(int, char*[]) {
try {
Calendar calendar = NullCalendar();
Date today = Date(18, December, 2017);
Settings::instance().evaluationDate() = today;
//market data
double cleanPrices1[] = { 107.96, 135.88, 110.6, 133.46, 135.8, 142.155, 121.045, 134.97, 117.04,
101.61, 128.67, 106.615, 106.36, 99.515, 101.21, 105.655, 114.828 };
double cleanPrices2[] = { 107.9, 134.965, 110.37, 132.89, 135.62,140.845, 120.585, 133.995, 116.745,
101.58, 128.115,105.985, 105.395,99.385, 100.79,104.955, 114.7985 };
double cleanPrices3[] = { 107.96, 134.625, 110.58, 132.65, 135.145, 140.585, 120.385, 133.735, 116.635,
101.62, 127.925, 105.6, 105.085, 99.29, 100.6, 104.945, 114.7415 };
double cleanPrices4[] = { 107.78, 134.39, 110.175, 132.445, 134.905, 139.515, 120.115, 133.475, 116.455,
101.58, 127.845, 105.53,104.805, 99.07, 100.46, 104.885, 114.6225 };
double coupons[] = { 0.053, 0.045, 0.04, 0.0435, 0.044, 0.043, 0.03375, 0.03875, 0.03,
0.015, 0.03625, 0.01375, 0.01625, 0, 0.00625, 0.01875, 0.04 };
Real redemption = 100.0;
const double FACE_VALUE = 100.0;
Date issueDates[] = { Date(12, May, 2004), Date(10, May, 2006),
Date(27, April, 2010), Date(14, October, 2010),
Date(11, July, 2012), Date(9, August, 2012),
Date(15, November, 2012), Date(8, February, 2013),
Date(28, February, 2013), Date(28, May, 2013),
Date(16, January, 2014), Date(21, January, 2015),
Date(21, January, 2016), Date(13, May, 2016),
Date(23, November, 2016), Date(9, March, 2017),
Date(27, March, 2006) };
Date maturityDates[] = { Date(12, May, 2019), Date(10, May, 2026),
Date(27, April, 2020), Date(14, October, 2025),
Date(11, July, 2029), Date(9, August, 2032),
Date(15, November, 2024), Date(8, February, 2033),
Date(28, February, 2023), Date(28, November, 2018),
Date(16, January, 2029), Date(21, January, 2027),
Date(21, January, 2031), Date(13, November, 2023),
Date(22, May, 2026), Date(9, March, 2037),
Date(26, March, 2021) };
int settlementDays[] = { 3, 3, 3, 3, 2, 2, 2, 2, 2, 3, 2, 2, 2, 2, 2, 2, 3 };
int curveSettlementDays = 2; //min of them^^^^
DayCounter dc[] = { Thirty360(), ActualActual(), ActualActual(), ActualActual(),
ActualActual(), ActualActual(), ActualActual(), ActualActual(), ActualActual(),
ActualActual(), ActualActual(), ActualActual(), ActualActual(),
ActualActual(), ActualActual(), ActualActual(), ActualActual() };
BusinessDayConvention accrualConvention = Following;
BusinessDayConvention convention = Following;
Frequency frequency = Annual;
//DateGeneration::Backward;
//Bond helpers
const Size numberOfBonds = (sizeof(coupons) / sizeof(coupons[0]));
std::vector<boost::shared_ptr<BondHelper> > bondHelpersA;
std::vector< boost::shared_ptr<SimpleQuote> > quoteA;
std::vector<boost::shared_ptr<BondHelper> > bondHelpersB;
std::vector< boost::shared_ptr<SimpleQuote> > quoteB;
std::vector<boost::shared_ptr<BondHelper> > bondHelpersC;
std::vector< boost::shared_ptr<SimpleQuote> > quoteC;
std::vector<boost::shared_ptr<BondHelper> > bondHelpersD;
std::vector< boost::shared_ptr<SimpleQuote> > quoteD;
for (Size i = 0; i < numberOfBonds; i++) {
boost::shared_ptr<SimpleQuote> cp1(new SimpleQuote(cleanPrices1));
quoteA.push_back(cp1);
boost::shared_ptr<SimpleQuote> cp2(new SimpleQuote(cleanPrices2));
quoteB.push_back(cp2);
boost::shared_ptr<SimpleQuote> cp3(new SimpleQuote(cleanPrices3));
quoteC.push_back(cp3);
boost::shared_ptr<SimpleQuote> cp4(new SimpleQuote(cleanPrices4));
quoteD.push_back(cp4);
}
RelinkableHandle<Quote> quoteHandleA[numberOfBonds];
RelinkableHandle<Quote> quoteHandleB[numberOfBonds];
RelinkableHandle<Quote> quoteHandleC[numberOfBonds];
RelinkableHandle<Quote> quoteHandleD[numberOfBonds];
for (Size j = 0; j < numberOfBonds; j++) {
quoteHandleA[j].linkTo(quoteA[j]);
quoteHandleB[j].linkTo(quoteB[j]);
quoteHandleC[j].linkTo(quoteC[j]);
quoteHandleD[j].linkTo(quoteD[j]);
}
std::vector<boost::shared_ptr<BondHelper> > instrumentsA;
std::vector<boost::shared_ptr<BondHelper> > instrumentsB;
std::vector<boost::shared_ptr<BondHelper> > instrumentsC;
std::vector<boost::shared_ptr<BondHelper> > instrumentsD;
for (Size j = 0; j < numberOfBonds; j++) {
Date bondSettlementDate = calendar.advance(issueDates[j], settlementDays[j] * Days);
Schedule schedule(bondSettlementDate, maturityDates[j], Period(frequency),
calendar, accrualConvention, accrualConvention,
DateGeneration::Backward, false);
boost::shared_ptr<FixedRateBond> bond(new FixedRateBond(settlementDays[j],
FACE_VALUE,
schedule,
std::vector<Rate>(1, coupons[j]),
dc[j],
convention,
redemption,
issueDates[j]));
boost::shared_ptr<BondHelper> helperA(new BondHelper(quoteHandleA[j], bond));
boost::shared_ptr<BondHelper> helperB(
new FixedRateBondHelper(quoteHandleB[j],
settlementDays[j],
FACE_VALUE,
schedule,
std::vector<Rate>(1, coupons[j]),
dc[j],
convention,
redemption,
issueDates[j]));
boost::shared_ptr<BondHelper> helperC(
new FixedRateBondHelper(quoteHandleC[j],
settlementDays[j],
FACE_VALUE,
schedule,
std::vector<Rate>(1, coupons[j]),
dc[j],
convention,
redemption,
issueDates[j]));
boost::shared_ptr<BondHelper> helperD(
new FixedRateBondHelper(quoteHandleD[j],
settlementDays[j],
FACE_VALUE,
schedule,
std::vector<Rate>(1, coupons[j]),
dc[j],
convention,
redemption,
issueDates[j]));
instrumentsA.push_back(helperA);
instrumentsB.push_back(helperB);
instrumentsC.push_back(helperC);
instrumentsD.push_back(helperD);
}
//Nelson-Siegel Fittings
Real tolerance = 1.0e-14;
Size max = 10000;
boost::shared_ptr<FittedBondDiscountCurve> tsA(
new FittedBondDiscountCurve(curveSettlementDays,
calendar,
instrumentsA,
ActualActual(),
NelsonSiegelFitting(),
tolerance,
max));
boost::shared_ptr<FittedBondDiscountCurve> tsB(
new FittedBondDiscountCurve(curveSettlementDays,
calendar,
instrumentsB,
ActualActual(),
NelsonSiegelFitting(),
tolerance,
max));
boost::shared_ptr<FittedBondDiscountCurve> tsC(
new FittedBondDiscountCurve(curveSettlementDays,
calendar,
instrumentsC,
ActualActual(),
NelsonSiegelFitting(),
tolerance,
max));
boost::shared_ptr<FittedBondDiscountCurve> tsD(
new FittedBondDiscountCurve(curveSettlementDays,
calendar,
instrumentsD,
ActualActual(),
NelsonSiegelFitting(),
tolerance,
max));
std::cout << tsA->fitResults().numberOfIterations() << std::endl;
std::cout << tsB->fitResults().numberOfIterations() << std::endl;
std::cout << tsC->fitResults().numberOfIterations() << std::endl;
std::cout << tsD->fitResults().numberOfIterations() << std::endl;
std::cout << tsA->fitResults().solution() << std::endl;
std::cout << tsB->fitResults().solution() << std::endl;
std::cout << tsC->fitResults().solution() << std::endl;
std::cout << tsD->fitResults().solution() << std::endl;
return 0;
}
catch (std::exception& e) {
std::cerr << e.what() << std::endl;
return 1;
}
catch (...) {
std::cerr << "unknown error" << std::endl;
return 1;
}
}
[/source]
Formally, the yield curve does not significantly change from day to day, but the model parameters do:
| Day | Beta_0 | Beta_1 | Beta_2 | Tau |
| 1 | -0.995577 | 0.988247 | 2.71207 | 0.00166491 |
| 2 | -0.763668 | 0.75673 | 1.93064 | 0.00249595 |
| 3 | -343.026 | 343.018 | 350.334 | 0.000453591 |
| 4 | -0.359727 | 0.353273 | 1.05588 | 0.00423456 |
Note that if you change the numerical method (from Simplex engaged by default to e.g. Conjugate Gradient, replacing NelsonSiegelFitting() with NelsonSiegelFitting(Array(), boost::shared_ptr
cannot be numerically solved any more!
Nelson-Siegel were aware of these problems and offered a way to solve them. In particular, they considered a time-series of Taus and determined the median and the plausible range for the best-fitting values of Taus (note that if
However, the original paper is, as usual, likely far more often cited than read. Additionally, one may get perplexed if required a time series of yields rather than to take the data just for the date in question. And even if dealing with time series is not a problem, Nelson and Siegel did not specify a formal algorithm to choose the best value for
FinViz - an advanced stock screener (both for technical and fundamental traders)