Market fall and so does Elle's portfolio. However, we still perform better than market due to diversification. So we use the opportunity to explain a 7-year old girl the idea of correlation.
Elle already knows that those, who want to see their portfolios growing must bear seeing them falling. Our current portfolio snapshot looks as follows:
| Asset | Units | Value € | PnL € | PnL % |
| COMSTAGE-DIVDAX UCITS | 3 | 91,47 | -3,09 | -3,27 |
| ETFS PHYSICAL SILVER | 7 | 90,23 | -2,7 | -2,91 |
As to the absolute loss, Elle takes it calmly and says: Five Euro and 79 cents? No problem, if it is really serious I can once skip going to McDonalds. As to relative numbers, Elle is still too young to understand them but if she could, she would likely also consider that -3% is actually within the bounds of daily volatility.
Anyway, we are doing (much) better than the market, because the DAX fell more than 6% (since 29.01.2018, when we made our first investment). And this is not only due to our "lucky" timing but also due to the diversification, the idea of which we tried to communicate to Elle.
First we asked her: if each asset either falls or grows and we currently have two assets in our portfolio, can you name all possible combinations of our assets' behavior? This question was not easy for her but after some time and hints she figured out all possible combinations: (up, up), (up, down), (down, up) and (down, down).
Then we explained her that first of all it is important to choose the assets that will likely go up rather than down. But we also should avoid such portfolio, whose constituents tend to fall together.
Further we told her that it is usually very hard to see in advance which asset will grow and which will fall. But it is possible to estimate whether they likely to fall together or not.
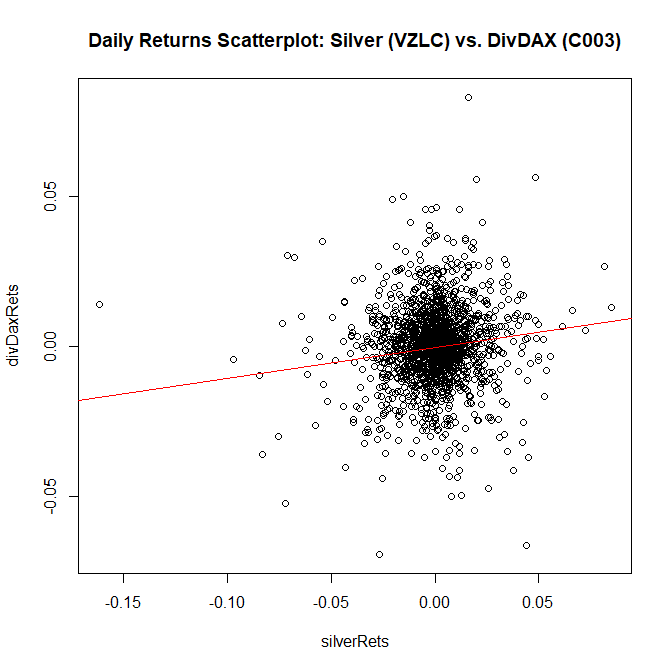
Of course we did not dwell in mathematical details of correlation estimation. Rather we told her, we have a computer program, which can draw us the charts, showing how the assets (returns) moved together in the past.
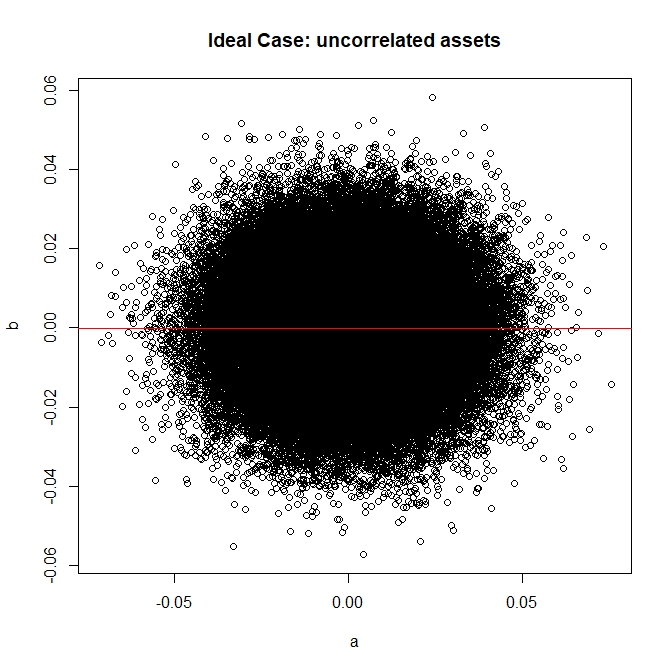
This is an ideal case (well-diversified, uncorrelated assets)
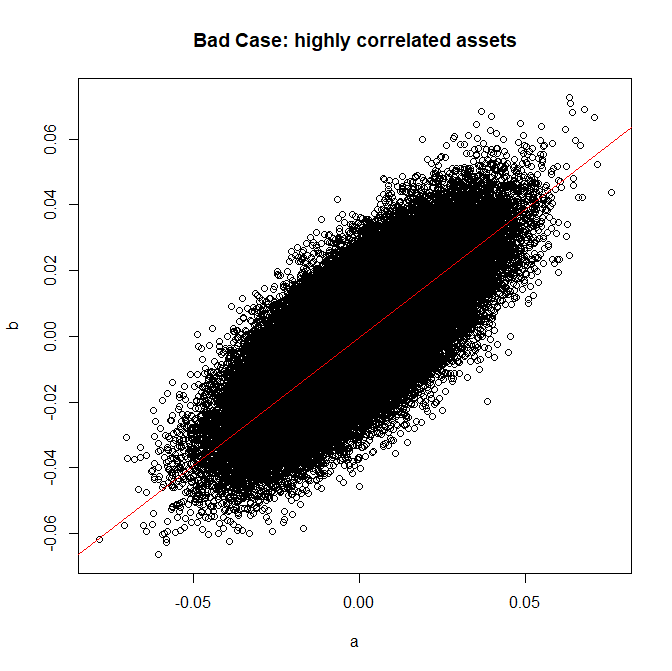
 and this case is really bad (badly-diversified, highly correlated assets)
 Then we asked Elle whether she considers our portfolio well or badly diversified (we put a cropped image on the right-hand side to help her to recognize the pattern). She easily coped with this challenge.
 |
 |
As to us, well, our achievement is somewhat less impressive. We merely managed to communicate the idea of diversification as: plot the asset returns by means of our program (which is a blackbox for Elle) and see whether the scatterplot is closer to an circle or to a straight line. It would be, so far, sufficient but the problem is how to continue the explanation in this way as the number of assets in portfolio continues to grow. Obviously we will create such scatterplots for the whole portfolio vs. new assets and bi-plots for each asset pair. We will she how digestible it will be for her mind...
And our adult readers are highly recommended to have a look at our advanced article, which explains why adding a new asset to portfolio does not necessarily mean a better diversification (and can actually mean more risk)!
Questions, suggestions, ideas from yourside! You are welcome to discuss them in Elle's forum!
FinViz - an advanced stock screener (both for technical and fundamental traders)