QuantLib development often lags the version of Visual Studio. Thus you need to do some manual tuning to build QL v1.14 in VS 2019. Generally, if you can, you shall so far stay by VS2017. Continue reading "Building QuantLib 1.14 with Visual Studio 2019 preview"
Category: Software
Salaries in German IT Branch – a Case Study of Critical Statistics Review
Recently I have read the results of salary survey among Russian-speaking software developers in Germany, published on dou.ua. I was skeptical about the validity of conclusions and expressed my critics (a bit less polite than I should have done it). But the survey author reasonably pointed out that he did his best in his free time and did provide the raw survey data. Recalling a popular motto in Soviet Union: if you are disagree then criticize but if you criticize then do it better I try to interpret the survey results more correctly. Continue reading "Salaries in German IT Branch – a Case Study of Critical Statistics Review"
PCA, Autoencoders and the Feasibility of Stockpicking
The idea that the stock picking makes less and less sense since the markets are more and more driven by the macroeconomic factors is quite popular.
Especially right now, as the markets are falling (like on todays FEd decision to increase the rates), this idea may seem to be plausible. However, we show that in the long term the stocks do show enough of individuality. Continue reading "PCA, Autoencoders and the Feasibility of Stockpicking"
letYourMoneyGrow.com Serves You on Ubuntu 18.04.1 LTS Linux
We have successfully migrated from Ubuntu 16 to Ubuntu 18, assuring stable and secure functioning of letYourMoneyGrow.com for the next several years. We had to disable social login but the users that registered with their social network accounts can use our services as before (they merely need to reset their passwords). Continue reading "letYourMoneyGrow.com Serves You on Ubuntu 18.04.1 LTS Linux"
Yahoo Finance Live Feeds in Excel after their API Discontinuation in November 2017
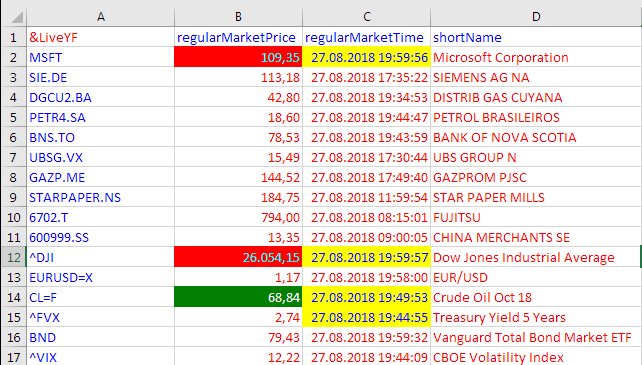
On the fateful Wednesday of November 1st, 2017 Yahoo decided to stop their – until then – free service of delivering real time market data as a text stream through a special URL. For hundreds of businesses and individuals who had relied for years on Yahoo's benevolent free service, this single action meant only one thing: Instant death! Continue reading "Yahoo Finance Live Feeds in Excel after their API Discontinuation in November 2017"
Pitfalls of Nelson-Siegel Yield Curve Modeling – Part II – what ML and AI can[not] do
In our previous post on Nelson-Siegel model we have shown some pitfalls of it. In this follow-up we will discuss how to circumvent them and how machine learning and artificial intelligence can[not] help. Continue reading "Pitfalls of Nelson-Siegel Yield Curve Modeling – Part II – what ML and AI can[not] do"
Pitfalls of Nelson-Siegel Yield Curve Modeling – Part I
The Nelson-Siegel-[Svensson] Model is a common approach to fit a yield curve. Its popularity might be explained with economic interpretability of its parameters but most likely it is because the European Central Bank uses it. However, what may do for ECB will not necessarily work in all cases: the model parameters are sometimes extremely unstable and fail to converge.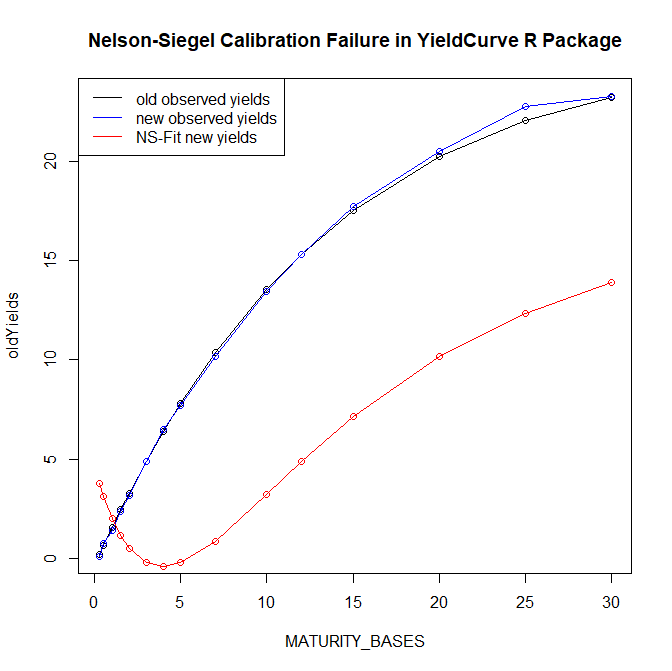 Continue reading "Pitfalls of Nelson-Siegel Yield Curve Modeling – Part I"
Building Open Source Risk Engine (Quaternion ORE) in VS2017 without Git
The Open Source Risk Engine is an opensource software project for risk analytics and xVA. It is written (mostly) in C++ and based on QuantLib. In this post we explain how the ORE can be built from source in Visual Studio 2017. Continue reading "Building Open Source Risk Engine (Quaternion ORE) in VS2017 without Git"
QuantLib Python – debugging C++ side with Visual Studio and PyCharm – a dirty way
QuantLib Python - a port of C++ library to Python via SWIG - provides a lot of advantages for a practical usage. In particular, it gives a great flexibility due to interactive python console and allows a seamless integration with the AI libraries like Keras and Tensorflow. However, it seems to be challenging to debug the C++ code, called from Python side. So far we found out a quick but dirty solution. Continue reading "QuantLib Python – debugging C++ side with Visual Studio and PyCharm – a dirty way"
Visualizing the Fundamental Data on 400 Stocks over 80 Quarters
It is relatively easy to visualize the aggregated statistics over many periods, e.g. by means of the boxplot series. However, it may be challenging if you want to have a simultaneous look at every element for all time periods. We propose to do it by means of an animated 3D-scatterplot. Continue reading "Visualizing the Fundamental Data on 400 Stocks over 80 Quarters"