By Elle's portfolio we implicitly target the CAGR of 6%. Alas, this year the CAGR turned out to be -24.7%! Especially our recent portfolio restructuring (sell Silver and buy DAX and WTI Oil) was not good.
Still we are better than a passive savings plan in DAX (this would have a CAGR of -30.7%) and look optimistically in future. Especially pleasant was Elle's reaction on the (temporary) drawdown: calm and stoic. This a necessarily trait for a growing Warren Buffet.
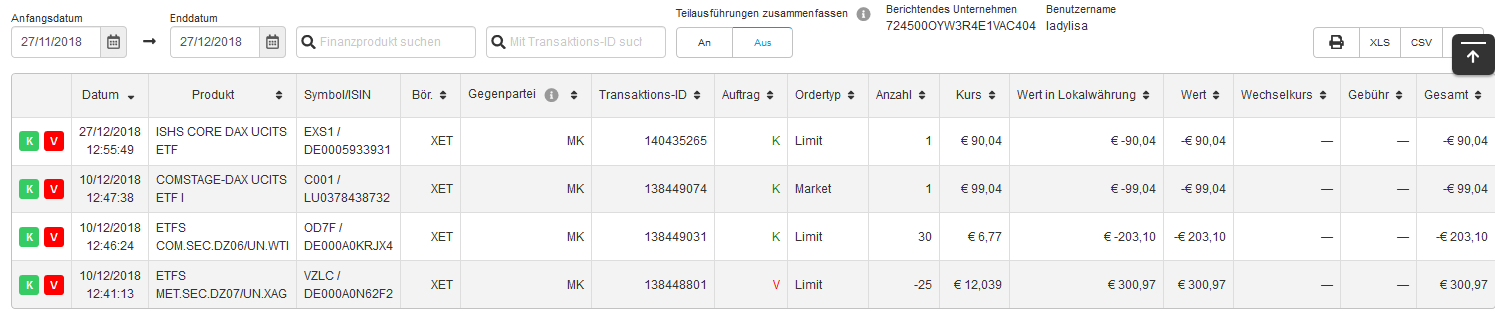
We will tell you nothing new if we mention that the year 2018 was pretty challenging for the traders and investors. But the turbulence and painful corrections is an immanent market trait. Anyway, recently we closed our position in silver at breakeven in order to increase our position in oil and DAX.
 This was a wrong decision (i.e. not just suboptimal but explicitly wrong) since there were good chances for silver to grow further and a significant risk that both DAX and Oil will continue falling just due to momentum. But it turned out to be a good learning with re-enforcement (and not only for Elle but for us, too).
As to our last transaction in this year, at first we considered to start re-building our position in silver but the chart suggests to wait for either the breakout of current resistance level or for a correction below €12.00.
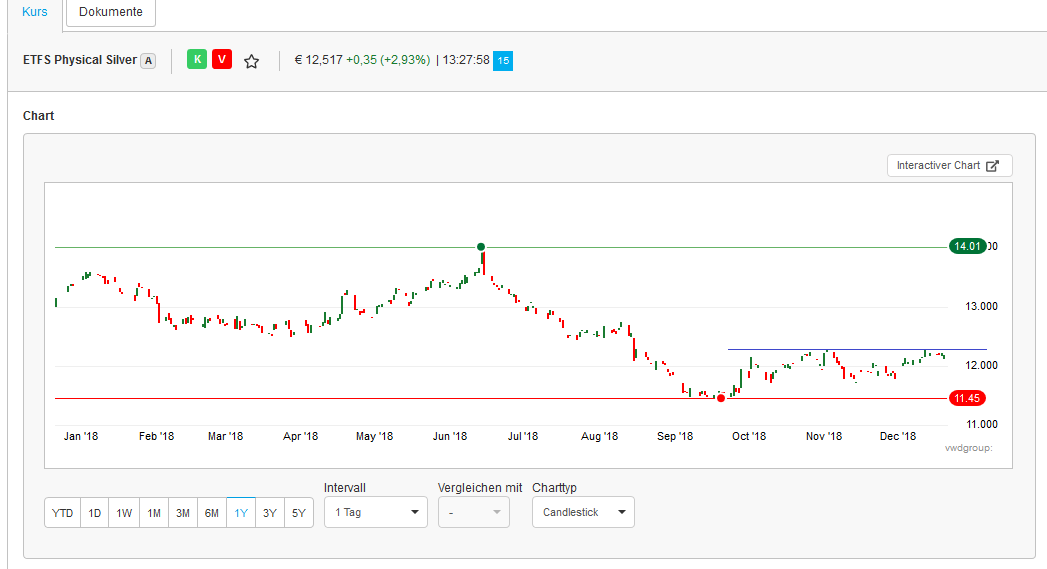 Thus we just invested our December installment in DAX ETF.
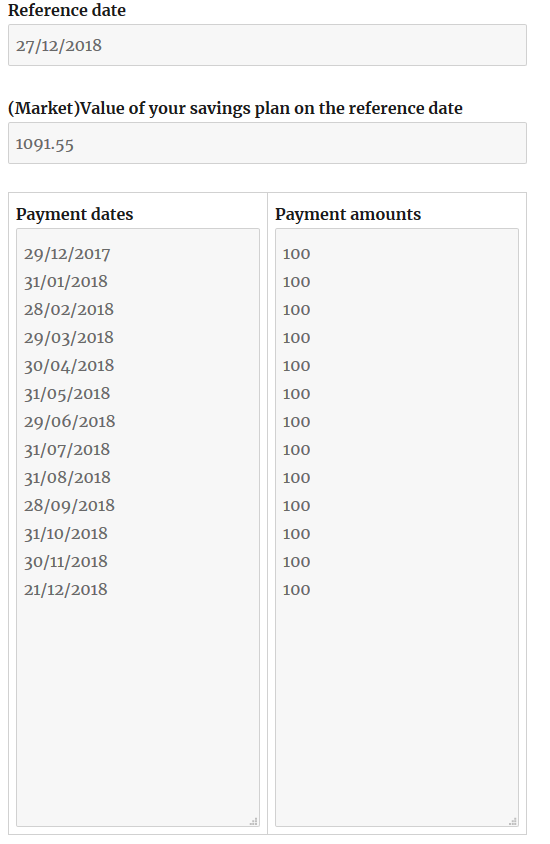
Now let us calculate our end of year result.
Our installments were as follows
| Date | Installment (EUR) |
| 02/01/2018 | 1 |
| 23/01/2018 | 100 |
| 01/02/2018 | 100 |
| 23/02/2018 | 100 |
| 23/03/2018 | 100 |
| 24/04/2018 | 100 |
| 23/05/2018 | 100 |
| 25/06/2018 | 100 |
| 23/07/2018 | 100 |
| 23/08/2018 | 100 |
| 24/09/2018 | 100 |
| 23/10/2018 | 100 |
| 23/11/2018 | 100 |
| 24/12/2018 | 100 |
| Totally | 1301 |
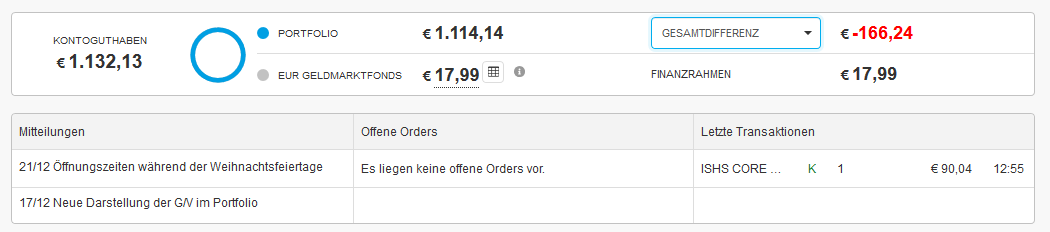
The current NAV of Elle's depot is 1132.13 EUR, which means that we have (temporarily) lost 168.87 EUR or , in relative terms, 13%. Note that DeGiro shows us the loss (Gesamtdifferenz) of €166.24, which is not correct (we explained the cause of this discrepancy here).
If we calculate the CAGR of our portfolio by means of our CAGR Calculator, we get even a more sorrowful value: -24,723%

However, let us compare this with an alternative, to which the apologist of passive investment exhort us at the top of their voices. Namely, let us have a look what would happened if we had just bought a DAX ETF in the end of each month.
To do this we first run the following R code
MONTHLY_INSTALLMENT = 100.0
LOOPBACK = 13 #13 monthly installments
library(quantmod)
getSymbols("^GDAXI")
monthlyReturnsDAX = monthlyReturn(GDAXI)
relevantRets = tail(monthlyReturnsDAX, LOOPBACK)
rets = as.numeric(relevantRets)
wealth = 0.0
for(m in 1:LOOPBACK) {
    wealth = (MONTHLY_INSTALLMENT + wealth)*(1.0+rets[m])
}
print(relevantRets)
print(wealth)
and get
> print(relevantRets)
           monthly.returns
2017-12-29   -0.0081650016
2018-01-31    0.0210441558
2018-02-28   -0.0571387828
2018-03-29   -0.0272694790
2018-04-30    0.0426048910
2018-05-31   -0.0005725215
2018-06-29   -0.0237121987
2018-07-31    0.0405899561
2018-08-31   -0.0344727211
2018-09-28   -0.0094895289
2018-10-31   -0.0652599243
2018-11-30   -0.0166210412
2018-12-21   -0.0553794632
> print(wealth)
[1] 1116.327
(Indeed, the wealth shall be equal to 1091.55) since yahoo.finance delivers us the data only till December, 21 2018 (DAX closed at 10634 on this day) and the current DAX value is 10398.
Using this data, we get a CAGR of -30.67%, so are still better than a passive savings plan!
Elle's current portfolio looks as follows and despite of our temporarily setback we have an optimistic sentiment for the future!

FinViz - an advanced stock screener (both for technical and fundamental traders)