The Open Source Risk Engine is an opensource software project for risk analytics and xVA. It is written (mostly) in C++ and based on QuantLib. In this post we explain how the ORE can be built from source in Visual Studio 2017. Continue reading "Building Open Source Risk Engine (Quaternion ORE) in VS2017 without Git"
Author: letYourMoneyGrow.com
JuniorDepot7b – Selling mDAX, Buying Platinum and Achieving 8% CAGR
Elle, a 7-year old girl, who learns to manage her wealth had some temporal setbacks but now reaches the CAGR of 8.065%. We recall the trades she has done and explain who one can easily calculate the CAGR of a saving plan. Continue reading "JuniorDepot7b – Selling mDAX, Buying Platinum and Achieving 8% CAGR"
Scalable Capital durchbricht Milliardengrenze – Erfolg des StartUps und Scheitern des Volkes
Scalable Capital, made-in-Germany Robo-Advisor, schafft es (mehr als) eine Milliarde Kapital zu sammeln. Wir sehen dahinter ein außergewöhnlicher StartUp-Erfolg und gewöhnliches Scheitern der Investment-Kultur in Deutschland. Continue reading "Scalable Capital durchbricht Milliardengrenze – Erfolg des StartUps und Scheitern des Volkes"
QuantLib Python – debugging C++ side with Visual Studio and PyCharm – a dirty way
QuantLib Python - a port of C++ library to Python via SWIG - provides a lot of advantages for a practical usage. In particular, it gives a great flexibility due to interactive python console and allows a seamless integration with the AI libraries like Keras and Tensorflow. However, it seems to be challenging to debug the C++ code, called from Python side. So far we found out a quick but dirty solution. Continue reading "QuantLib Python – debugging C++ side with Visual Studio and PyCharm – a dirty way"
JuniorDepot7a – Selling Silver and Buying DAX ETF
According to our plan, we sold a silver ETC near the upper line of a clearly visible channel. Today we used the DAX correction to re-buy an ETF on it. Continue reading "JuniorDepot7a – Selling Silver and Buying DAX ETF"
Investor, get rid of information overload!
Retail investors are overwhelmed with information. Meanwhile the payload of these numerous analytics and market reviews is zero or even negative. Is a passive investment in an index ETF a solution to this problem? Yes, but not necessarily the best one. We provide a short list of S&P 500 stocks with good fundamentals, low volatilities and correlations and nice charts from technical point of view. Continue reading "Investor, get rid of information overload!"
Visualizing the Fundamental Data on 400 Stocks over 80 Quarters
It is relatively easy to visualize the aggregated statistics over many periods, e.g. by means of the boxplot series. However, it may be challenging if you want to have a simultaneous look at every element for all time periods. We propose to do it by means of an animated 3D-scatterplot. Continue reading "Visualizing the Fundamental Data on 400 Stocks over 80 Quarters"
Classifying Time Series with Keras in R : A Step-by-Step Example
We test different kinds of neural network (vanilla feedforward, convolutional-1D and LSTM) to distinguish samples, which are generated from two different time series models. Contrary to a (naive) expectation, conv1D does much better job than the LSTM. Continue reading "Classifying Time Series with Keras in R : A Step-by-Step Example"
JuniorDepot7 – Buying Silver
The current direction of the stock market remains vague, additionally we remember sell in May and go away. Thus Elle bought silver this time, which also improved the diversification of her portfolio.
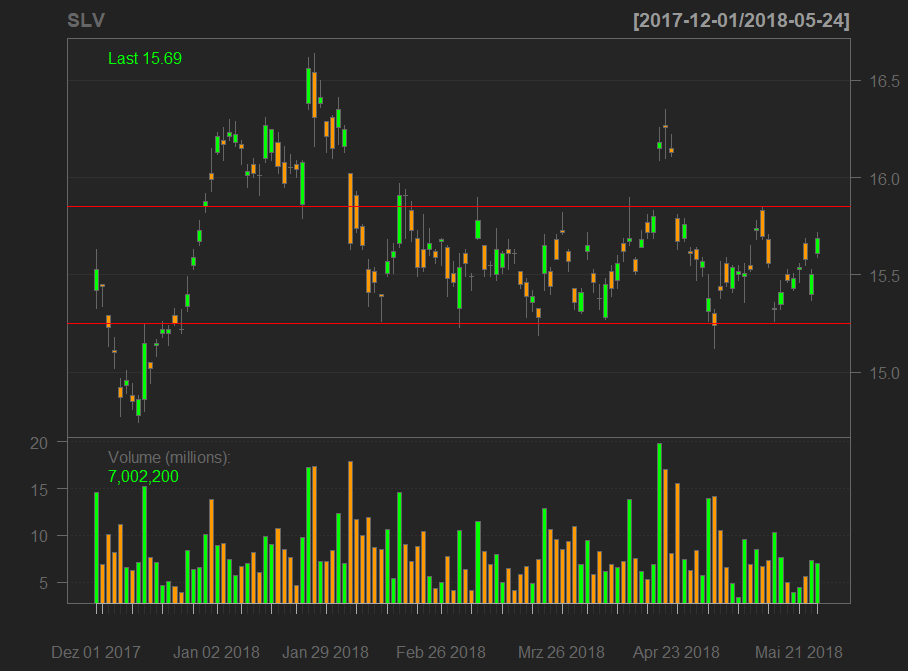 Continue reading "JuniorDepot7 – Buying Silver"
R code to detect support and resistance levels
Support and resistance levels are quite popular among traders. Although they are implemented in many apps and services, an open source implementation of the algorithm is hardly available. We try to close the gap.
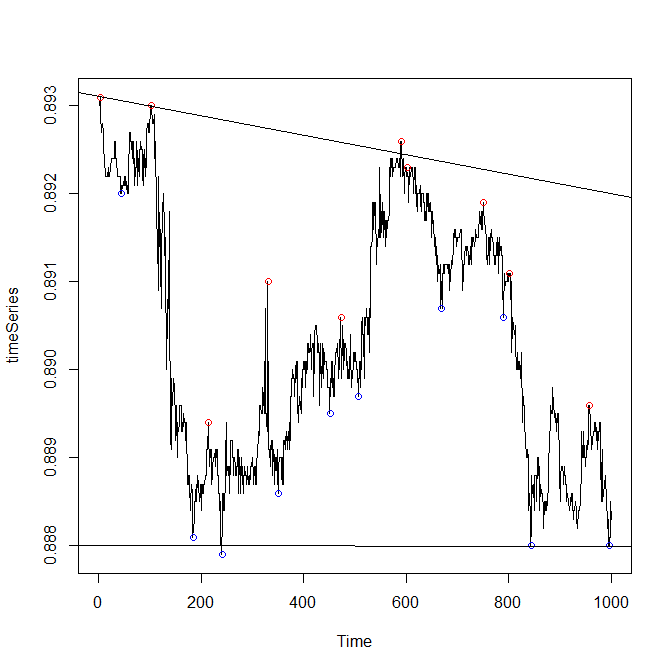 Continue reading "R code to detect support and resistance levels"