By current artificial intelligence, big data and robo-advisory hype many people believe that computers can do everything for you. I am pretty skeptical about it. Never denying (and actively engaging by myself) a computer-aided trading and investment I always claim "man and machine" rather than "man vs. machine". In this post I show you how to summarize and visualize the data from Alpha Vantage for 6356 American stocks. Continue reading "Visualizing the Data on 6356 American Stocks – with R source code"
Category: AmericanStocks
JuniorDepot5 – Learning Pain of Loss with GoPro Action
Elle, a 7-year old girl, insisted last month on investing in GoPro. Now she has to learn the pain of losing money.
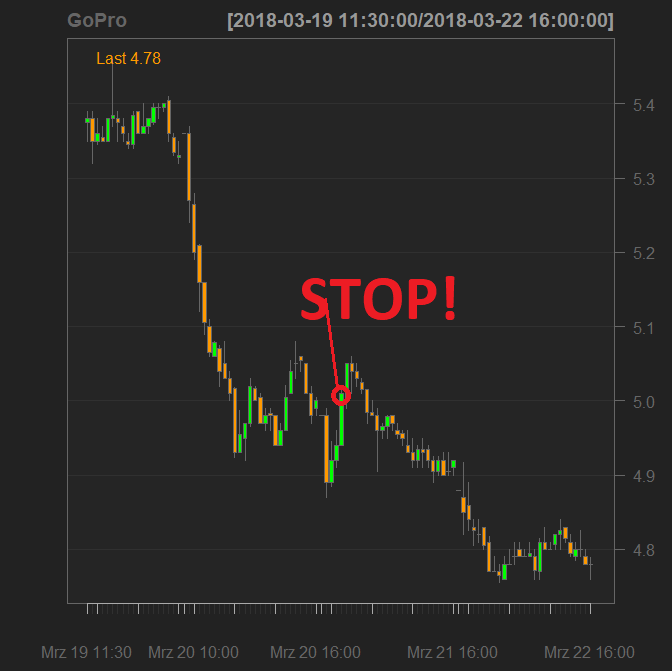 Continue reading "JuniorDepot5 – Learning Pain of Loss with GoPro Action"
Gallery of TBOT – triangle bottoms according to Lo et al 7/8
We continue publishing the visual results from Vasily Nekrasov's attempt to reproduce the results from "Foundations of Technical Analysis: Computational Algorithms, Statistical Inference, and Empirical Implementation" by Lo, Mamaysky and Wang(2000). Continue reading "Gallery of TBOT – triangle bottoms according to Lo et al 7/8"
Gallery of RTOP – rectangle tops according to Lo et al 6/8
We continue publishing the visual results from Vasily Nekrasov's attempt to reproduce the results from "Foundations of Technical Analysis: Computational Algorithms, Statistical Inference, and Empirical Implementation" by Lo, Mamaysky and Wang(2000). Continue reading "Gallery of RTOP – rectangle tops according to Lo et al 6/8"
Gallery of RBOT – rectangle bottoms according to Lo et al 5/8
We continue publishing the visual results from Vasily Nekrasov's attempt to reproduce the results from "Foundations of Technical Analysis: Computational Algorithms, Statistical Inference, and Empirical Implementation" by Lo, Mamaysky and Wang(2000). Continue reading "Gallery of RBOT – rectangle bottoms according to Lo et al 5/8"
Patterns of Technical Analysis – Do They Work?
Seven years ago I tried to reproduce the results of "Foundations of Technical Analysis: Computational Algorithms, Statistical Inference, and Empirical Implementation" by Lo, Mamaysky and Wang with more recent data than they used. Lo et al come to the conclusion that the chart patterns are statistically significant (which does not yet mean their practical usability). My results shows that there is no statistical significance (anymore). Continue reading "Patterns of Technical Analysis – Do They Work?"
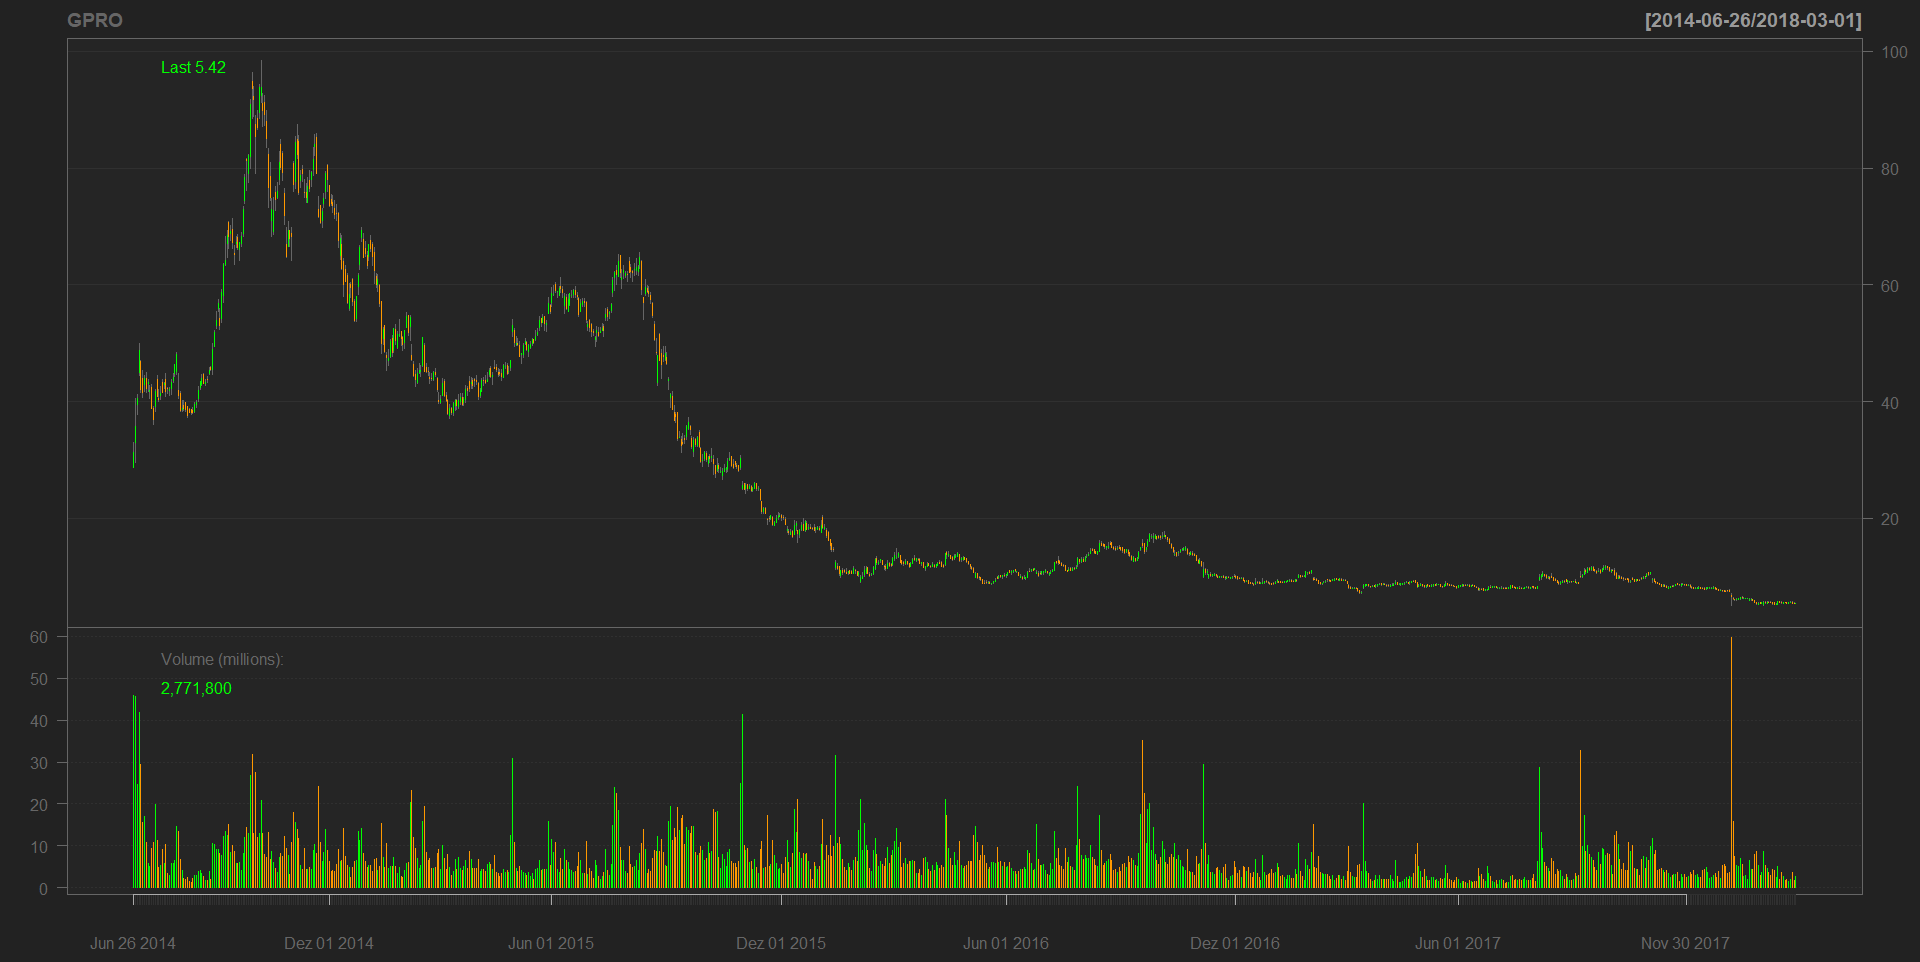
JuniorDepot4 – Becoming Pro with GoPro
Elle, a 7-year old girl, made her hands dirty in stock picking. This time she decided to buy GoPro stock. I was about to make use of my veto right but finally found her decision not bad at all.
 Continue reading "JuniorDepot4 – Becoming Pro with GoPro"
Volatility Clustering and Piecewise Homoscedasticity – Part II – 2940 stocks – [M-Z]
Stock tickers from M to Z. Continue reading "Volatility Clustering and Piecewise Homoscedasticity – Part II – 2940 stocks – [M-Z]"
Volatility Clustering and Piecewise Homoscedasticity – Part II – 2940 stocks – [G-L]
Stock tickers from G to L. Continue reading "Volatility Clustering and Piecewise Homoscedasticity – Part II – 2940 stocks – [G-L]"
Volatility Clustering and Piecewise Homoscedasticity – Part II – 2940 stocks – [D-F]
Volatility clustering plots for stocks with yahoo.finance tickers from D to F. Continue reading "Volatility Clustering and Piecewise Homoscedasticity – Part II – 2940 stocks – [D-F]"